Module 8 - Incorporating Ancillary Equipment and Interfaces
Introduction
This manual provides instructions for the installation and integration of ancillary components and platforms onto an OptaSense system. The following ancillaries are detailed within this document:
- GPS Modem (SMS)
- Email Interface
- Camera Interface
- Moxa Dry Contact
- OPC-UA Interface
- HTTP Interface
- Modbus
- Connect Agent
Installing External Comms (and other Interfaces)
The External Comms Interface (Email, SMS) is not installed by default and will need to be added via the ‘System Install Scheduler’.
The interface to add in this editor is the ‘External Communications Controller’. Please seek Module 12 which describes the steps of adding a new interface into the system.
Once added should you continue the next steps in this manual.
Teltonika - SMS and NTP
Hardware Setup
The OptaSense System uses a Teltonika RUT955 or RUT956 modem to provide NTP, SMS and data connection capabilities. This section will deal with setting up the hardware for SMS functionality.
The following schematic shows an overview of the modem’s connectivity. For details regarding the modem’s specification, mounting and power requirements, please refer to the manufacturer’s User Manual.
The Modem is supplied with a 9V DC 4 pin adapter with an IEC Input connection as shown below:
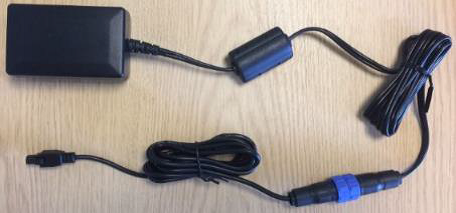
Figure 1: OPN_90013_REV_1 - 110V ~ 230V AC IEC Input to 4 Pin DC Output Power Supply
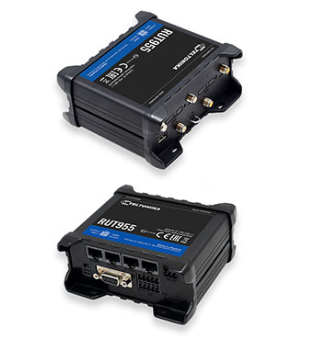
Figure 2: OPN_90014_REV_1 - Teltonika RUT955 (Worldwide Variant)
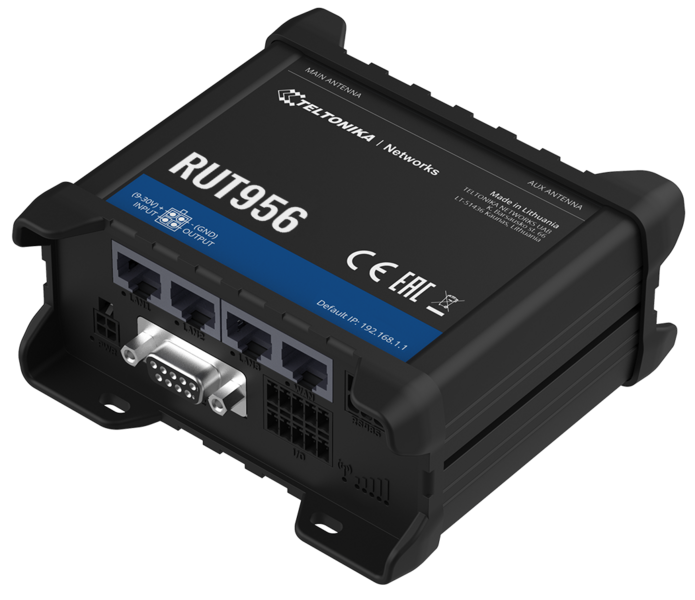
Figure 3: : OPN_90014_REV_2 - Teltonika RUT956 (Worldwide Variant), will be replacing OPN_90014_REV_1 soon!
The modem unit needs to have a working sim card inserted, only a standard size SIM card will fit the modem.

Figure 4: Standard size SIM card
There is also an additional SIM slot, this can be used to provide dual redundancy. Slot 1 is to be used for the primary sim card slot.
 Mobile Main Antenna Connection:
The modem is supplied with a GPS, Mobile (GSM) and WIFI Antenna
which should be installed outside to ensure the best possible signal reception.
Always refer to the system documentation to check if the other Antennas
need to be connected to the unit.
Figure 5: OPTA0740 Rev 2 / CBT 7800236 - Antenna Bracket with OPTA0741 Rev 1 3G GSM GPS and Wifi Antenna
OptaSense are phasing out the supply of the above antenna which will be superseded by a 4G capable antenna which is larger and looks like this:

Figure 6 - OPN_90132_REV_1 - 4G GSM GPS and Wifi Antenna
In applications where only one sim card is required, the sim card needs to be installed into SIM1 port and the associated antenna needs to be connected to the Mobile MAIN antenna connector, please note the positions of this connector in under the red arrow.
In applications where two sim cards are installed the second sim card needs to be inserted into SIM2 port which antenna needs to be connected to Mobile AUX antenna connector highlighted with the blue arrow.
The silver sim insertion / extraction tool is highlighted by the green arrow.

Figure 7: Main Antenna Label on Front Panel
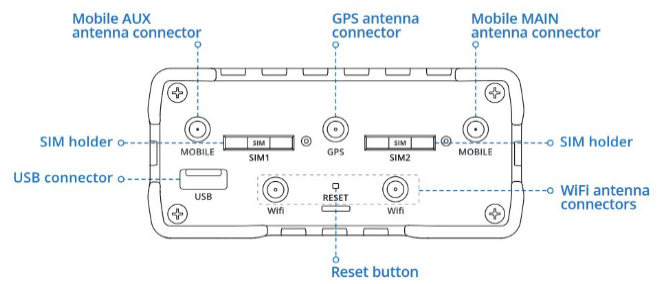
Figure 8: RUT955 / RUT956 Top Connections
Please note:
SIM 1’s Sim Card port is on the opposite side to the corresponding Mobile MAIN antenna connector.
SIM 2’s Sim Card port is on the opposite side to the corresponding Mobile AUX antenna connector.
The silver sim insertion / extraction tool is highlighted by the green rectangle.
Colours used to highlight the related ports and connections.
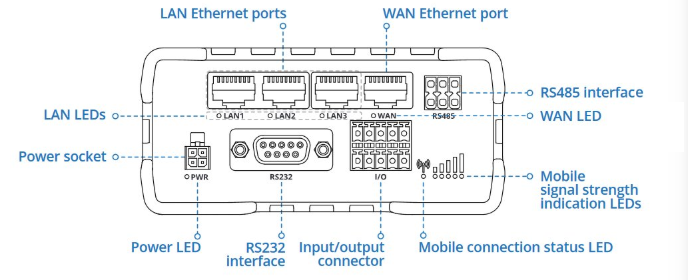
Figure 9: RUT955 / RUT956 Bottom Connections
The RUT955 or RUT956 (NTP unit) can now be plugged into the systems Gigabit Ethernet Switch (GES) from the port labelled LAN1 on the NTP (RUT955 or RUT956) unit.
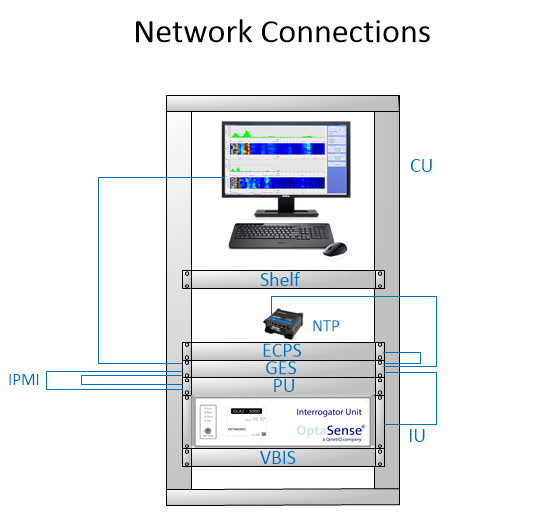
Figure 10: NTP Network Connections
In most setups the system components will be connected through a gigabit switch. Using the Teltonika RUT955 or RUT956 as a network switch is not recommended. The RUT955 and RUT956 is limited to 100 Base T, thus it should not be used in place of a Gigabit switch.
The modem should be installed into the equipment rack using the DIN rail kit which screws onto the rear of the unit in two positions.
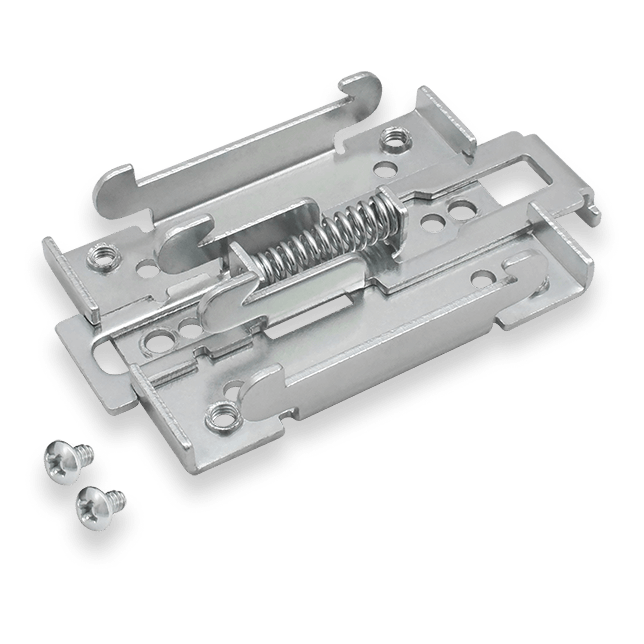
Figure 11: OPN_90042_REV_1 - DIN Rail Kit (Rear Mounting Kit for RUT955 or RUT956 Units)
The DIN Rail Kit clips onto the DIN Rail Rack Installation Kit shown in Figure 12:
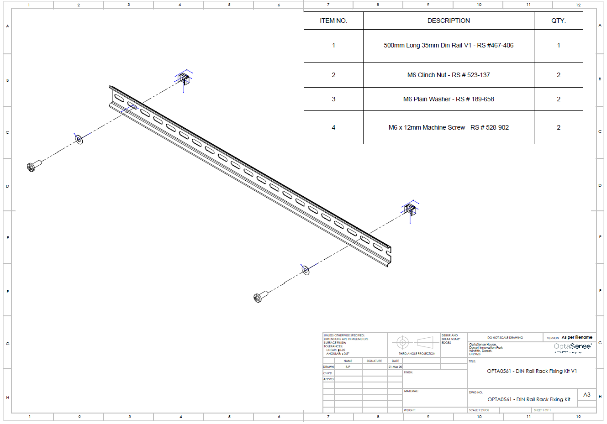
Figure 12: OPN_90030_REV_1 - DIN Rail Rack Fixing Kit
Software Setup
To get a connection from CU to the modem, both need to be on the same network. On the CU, right-click on the network icon in the bottom right-hand corner of Windows home screen. Select Open Network Internet settings.

Figure 13: Network Internet Settings
Right-click on Ethernet and select properties.

Figure 14: Ethernet Properties
Select Internet Protocol Version 4 (TCP /IPv4) and then select Properties.
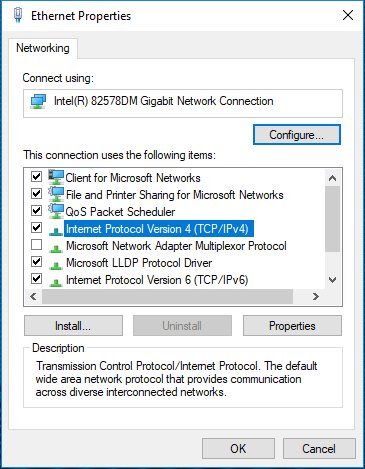
Figure 15: Internet Protocol IPv4 Properties
Change the IP address to be on the same network as the modem.
The default IP address for the modem is “192.168.1.1”.
For example, if the modem is “192.168.1.1” then the CU’s IP address can be “192.168.1.2”. The Subnet mask can be left as default. Select OK to commit the changes.
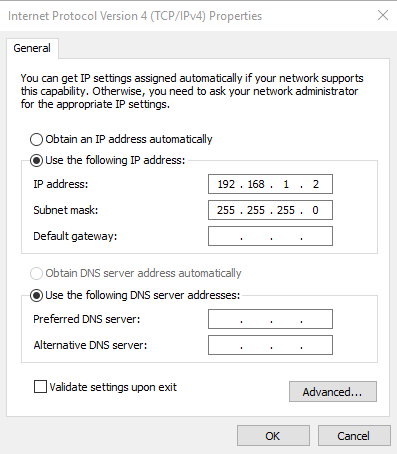
Figure 16: Changing IP Address
The modem’s interface should now be accessible. To access it, type in an internet browser 192.168.1.1 and press enter. Internet explorer works well ![]() . The default login details are Username: admin & unique password is stated on the rear of the unit!
. The default login details are Username: admin & unique password is stated on the rear of the unit!
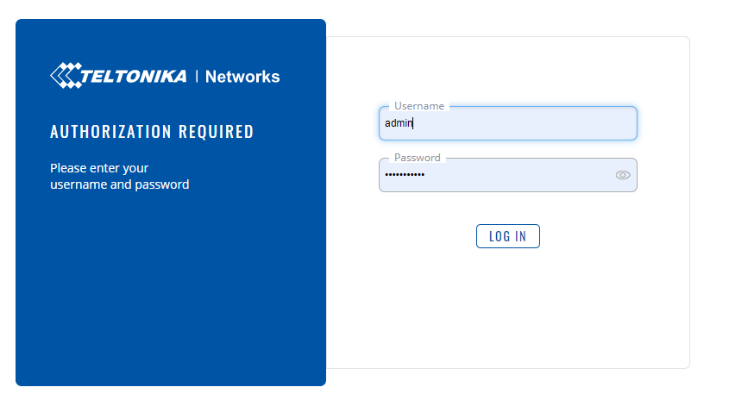
Figure 17: Modem Login
When prompted to change the password, change it to OptaAdmin01
Please note the default password for the units may not be Admin01 as it was in the past.
The default password is printed on the rear of the unit and should be photographed and uploaded to Jira against the related AMT for future reference if it is ever required.
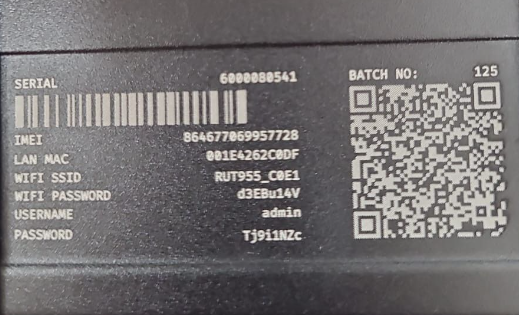
Figure 18: Each RUT955 and RUT956 now has a unique default password printed onto the rear of the unit!
To configure the Teltonika for use open go to the mode option (1) and click on the mode until it displays Advanced as shown.
Then navigate to the System tab (2) and select Setup Wizard (3) from the drop-down menu.
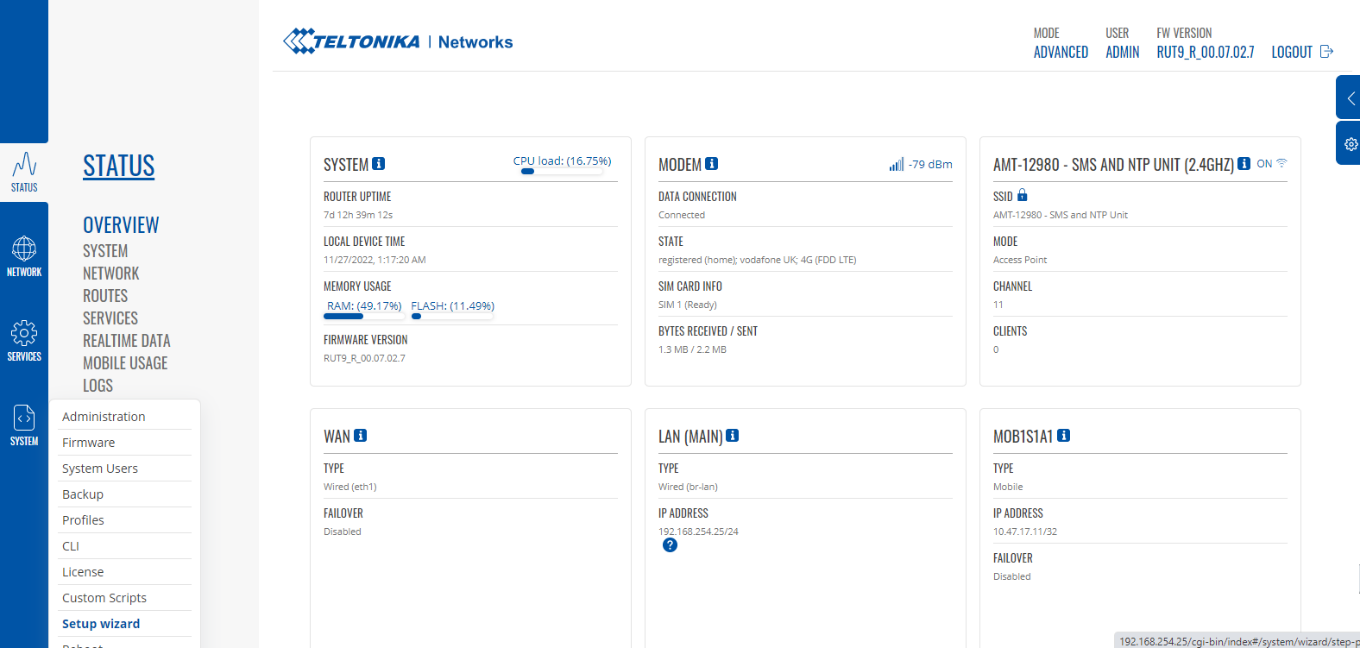
Figure 19: Setup Wizard Location
Follow the steps described below:
From the System Tab (1)
Step 1- General Tab (2)
- Under WebUI Settings:
Check that the Configuration Mode (3) is set to Advanced.
- Under General Settings:
The Time Zone section (4) can be left as default UTC
Finally select Next (5) to apply the settings.
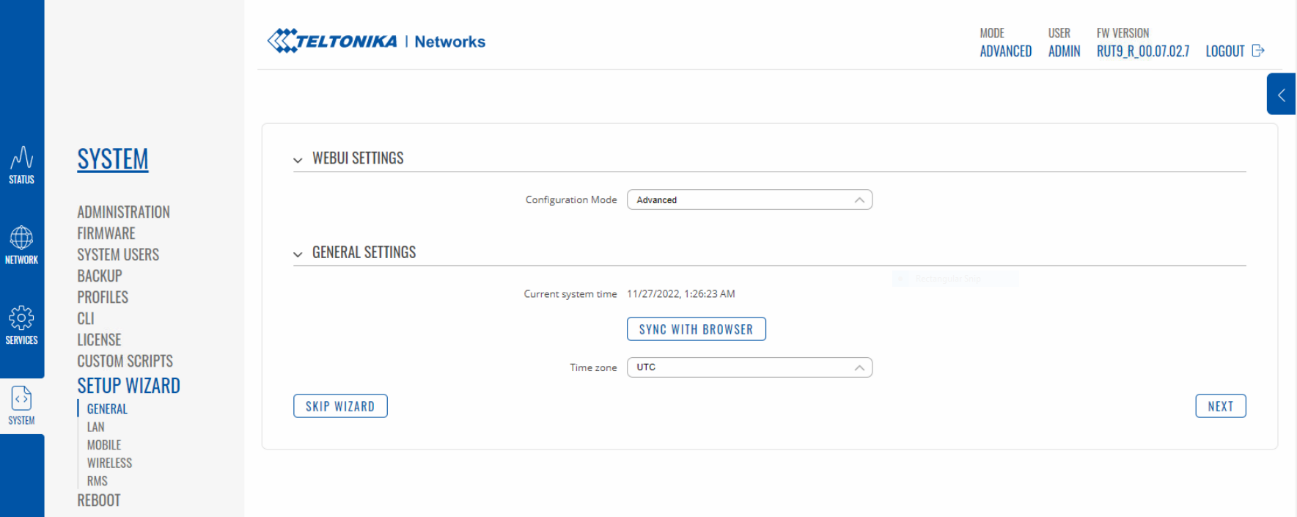
Figure 20: Step 1 - General Settings
Note the next stage has changed order from the previous RUT955 configuration process, this is now LAN configuration!
Step 2 - LAN Configuration
From the LAN menu (1).
Set the IP Address (2) as per the approved system documentation
Set Enable DHCP (3) to OFF.
Finally select Next (4) to apply the settings.
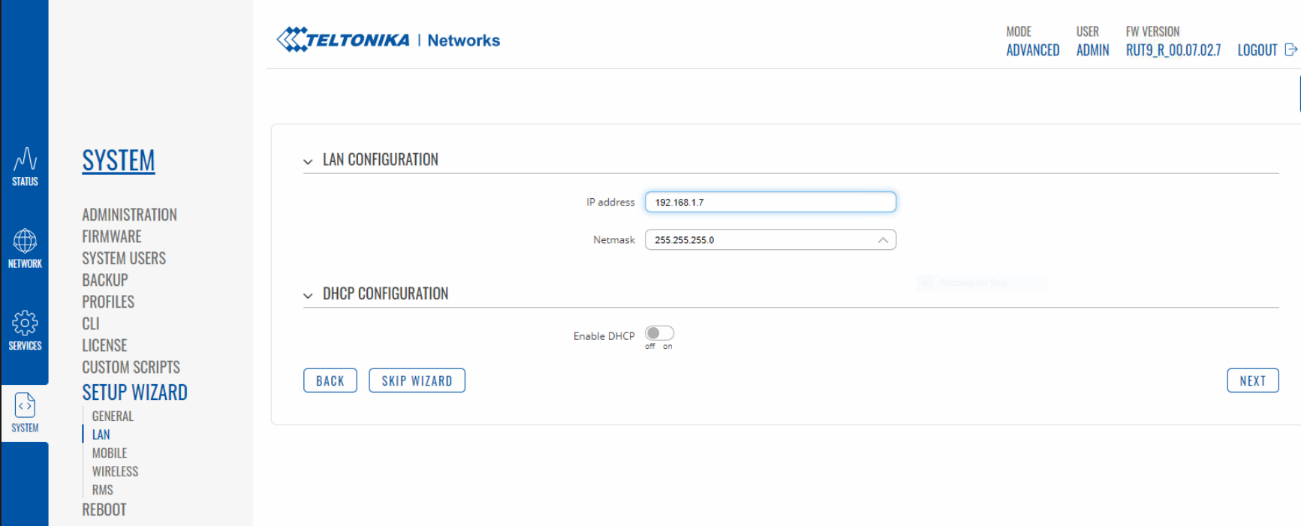
Figure 21: Step 2 - LAN Configuration
Step 3 - (Mobile Tab)
In the mobile configuration section, if the APN details are known, they can be manually entered by turning Auto APN to OFF.
If the APN is not know Auto APN should be set to ON as default.
Finally select Next (3) to apply the settings.
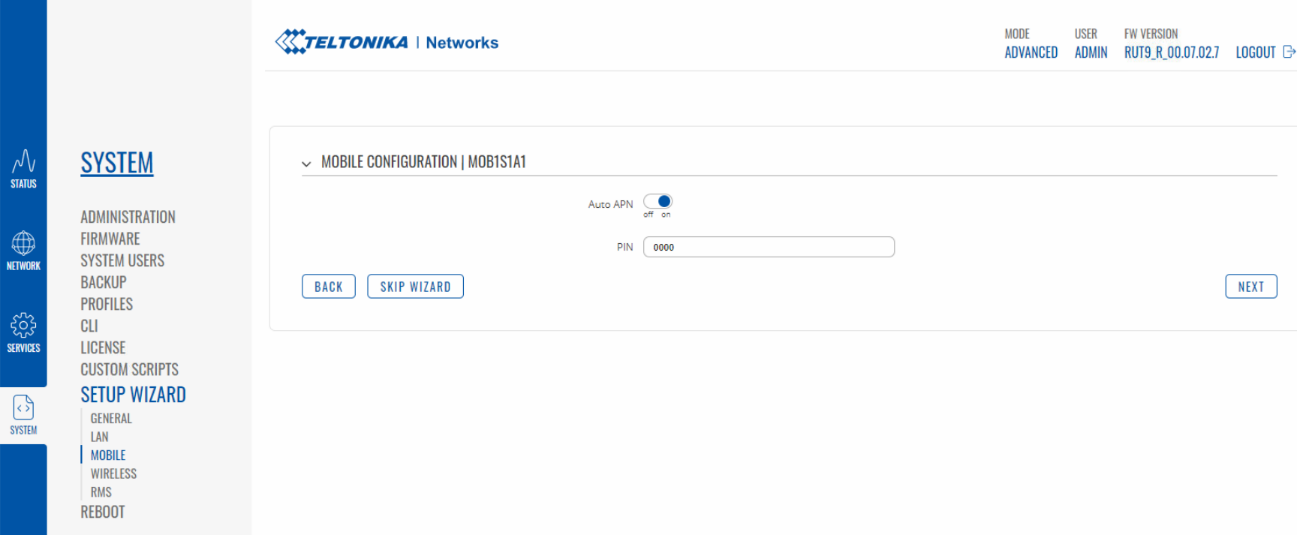
Figure 22: Step 3 - Mobile Configuration
Step 4 (Wi-Fi Tab):
- From System Tab (1).
- Via the Wireless Tab (2)
- Make sure Enable is set to OFF (3).
- Type in the units unique AMT reference as per the reference image into the ESSID box (4).
- Set this password to OptaAdmin01 (5).
- Finally select Next (6) to apply the settings.
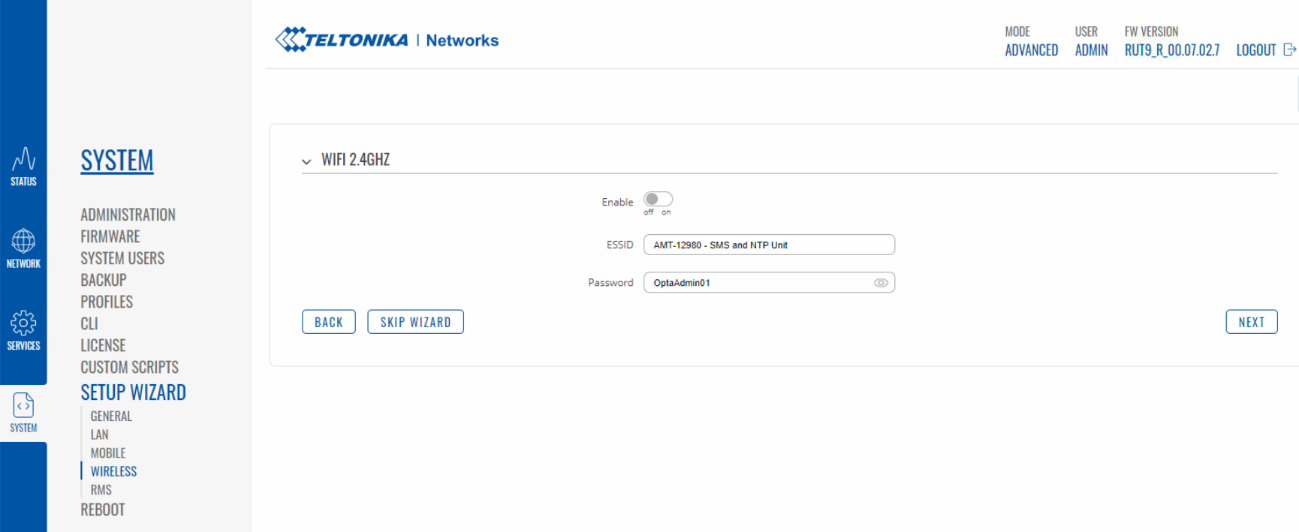
Figure 23: Step 4 - Wi-Fi Settings
Step 5 - (RMS Tab)
From System Tab (1).
- Via the RMS Tab (2)
- Make sure Connection Type is set to Disabled (3).
- Finally select Finish (4) to apply the settings and complete the wizard.

Figure 24: Step 5 - RMS Settings
System Administration Settings
- Select the System tab (1).
- Navigate to, then select the Administration tab (2) from the drop-down menu.
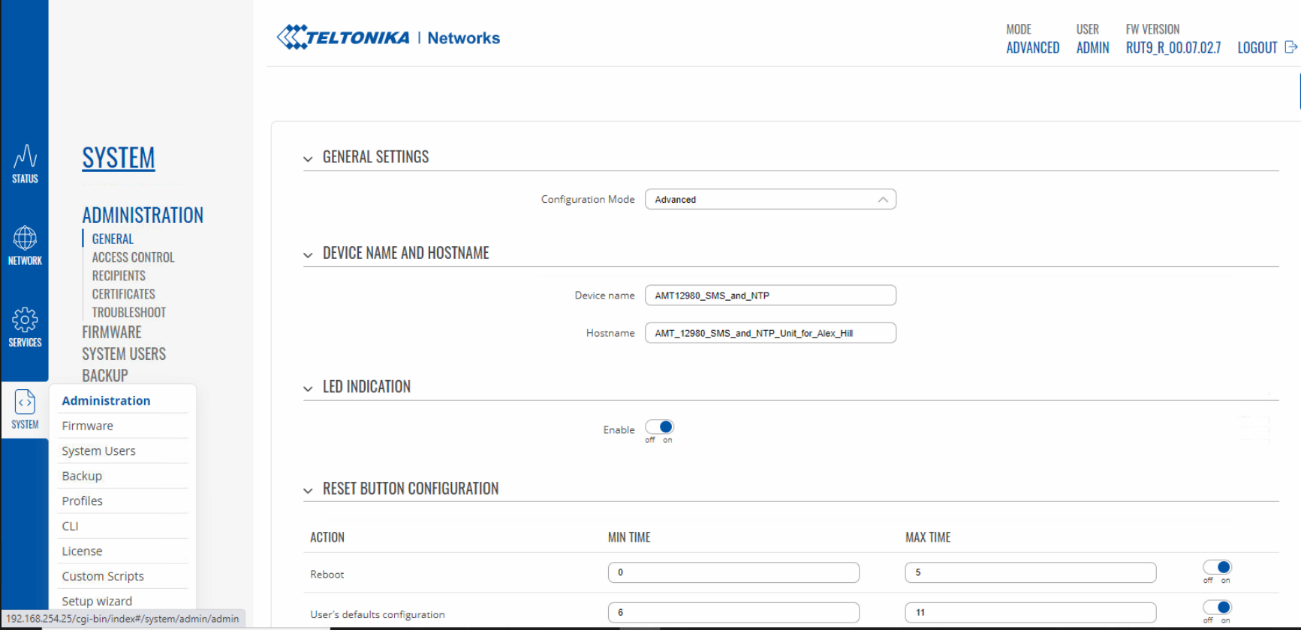
Figure 25: System / Administration Menu
- Go to Access Control option (1).
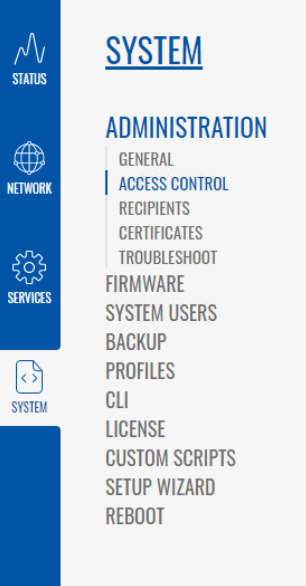
Figure 26: System / Administration Menu/ Access Control Menu
- Via the General tab (1).
- Turn ON the Enable SSH Access Secure (2) option.
- Finally select Save & Apply (3) to apply the setting(s).
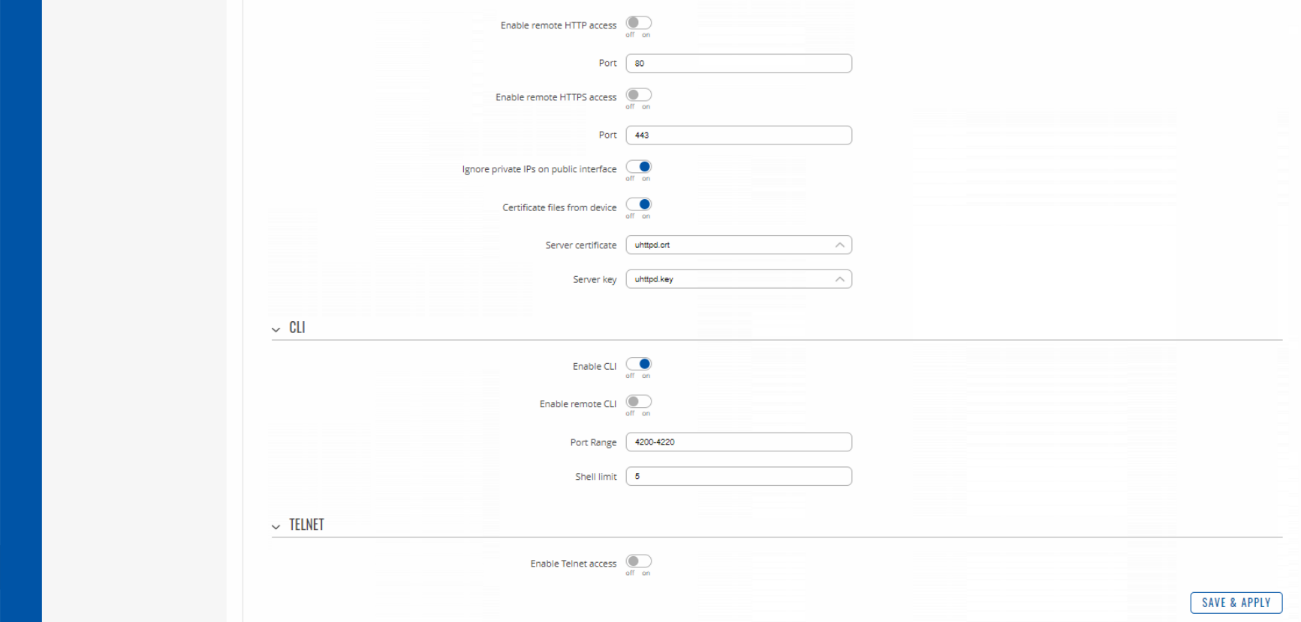
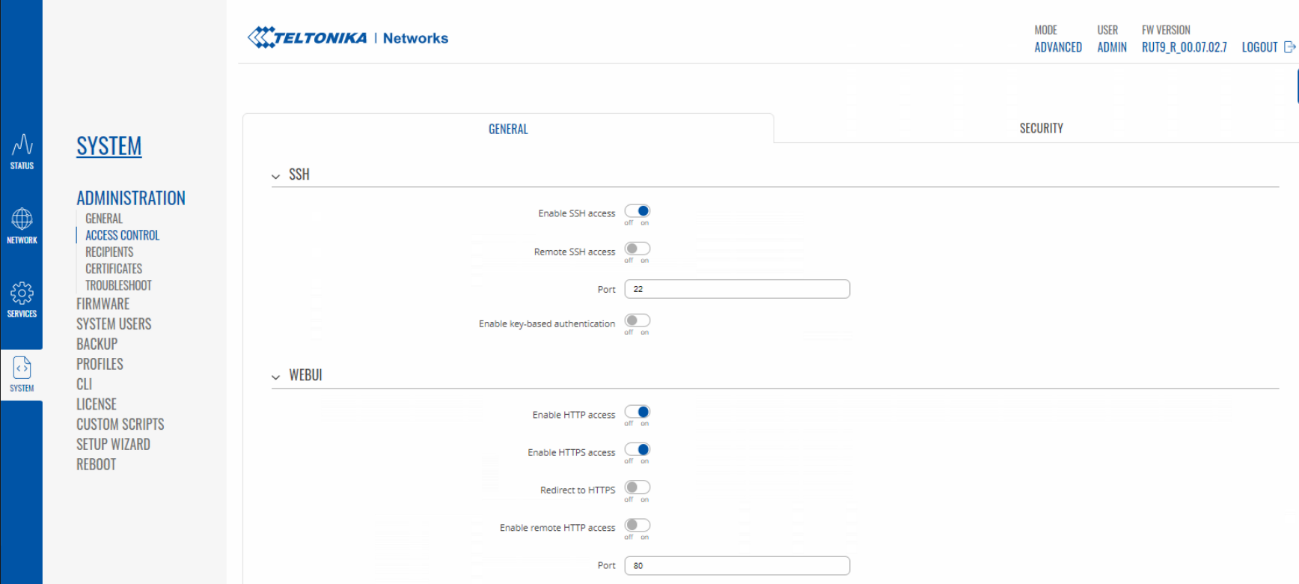
Important – Before you continue ensure you are not in the wrong tab, you should be in the Security tab (1) and NOT the General tab as shown in Error! Reference source not found. SSH MUST be enabled in the General Tab, it is advised to double check this before you continue.
- Via the Security tab (1).
- Turn OFF the Enable (2) toggle for IP Block Setting.
- There should be no Blocked Addresses (3) listed in the section named Login Attempts, so a visual check is required to ensure there are no blocked IP addresses.
- Finally select Save & Apply (4).

Figure 28: Access Control / Security Window
The IP address of the modem now needs be changed to be on the same network as the PU (refer to the approved documentation to check the IP address before continuing.
The next steps are to:
- Select Network (1).
- Select Interfaces (2).
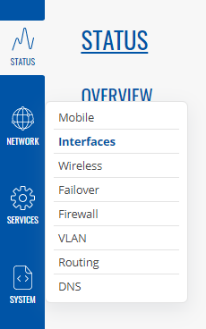
Figure 29: Network / Interfaces Menus
This will take you to this window:
- Locate the pencil icon for the LAN connection (1).
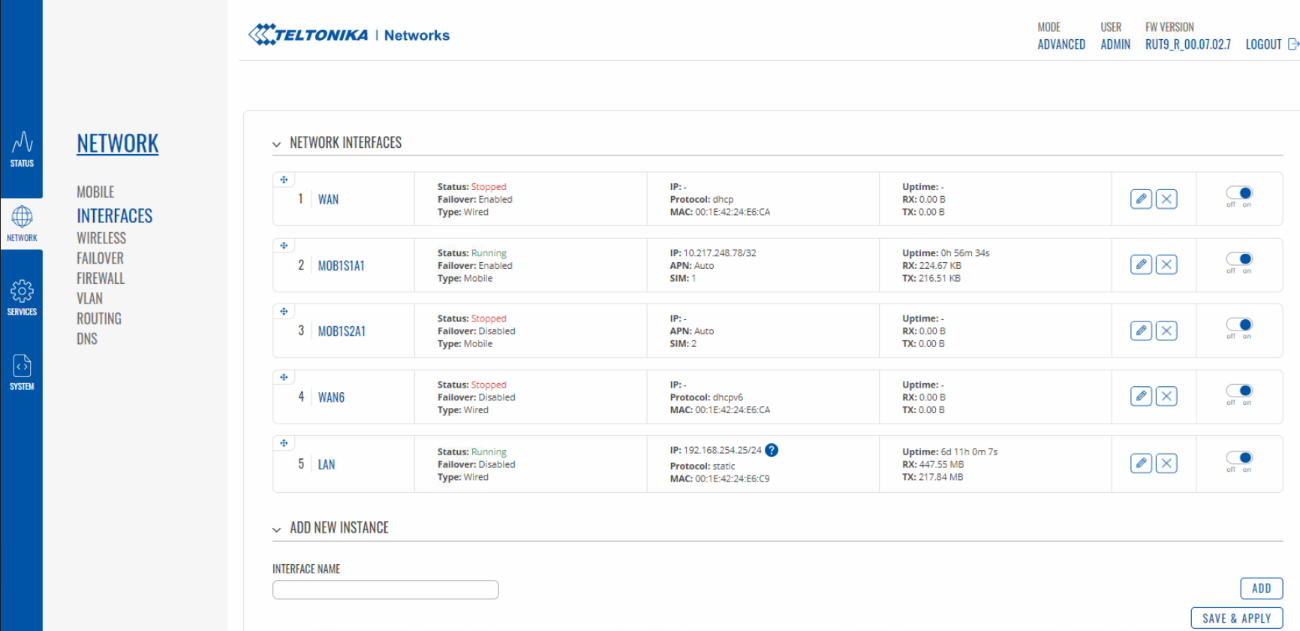
Figure 30: Network Interfaces
- Set the Protocol to Static from the dropdown selection (1).
- Set the IPv4 address as per the approved system documentation (2).
- Set the IPv4 netmask as per the approved system documentation (3).
- Set the IPv4 gateway as per the approved system documentation (4).
- Set the DNS servers as per the approved system documentation (5).
- Under General Setup, IPV6 Settings section set Enable DHCP to Disable (6).
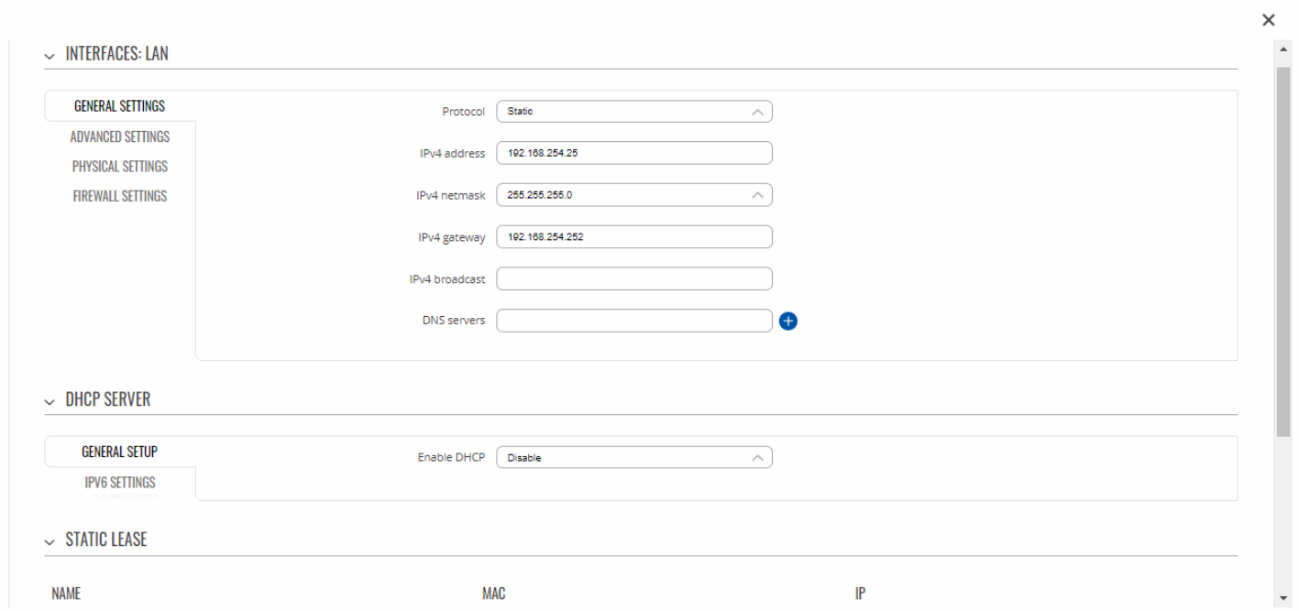
Figure 31: Interfaces LAN (Top part of this display)
Please note that this window has a slider bar as per (7) (not all of the options will be visible on the initial view)!
- Scroll down to the bottom of this window.
- Press Save & Apply to finish this section (8).
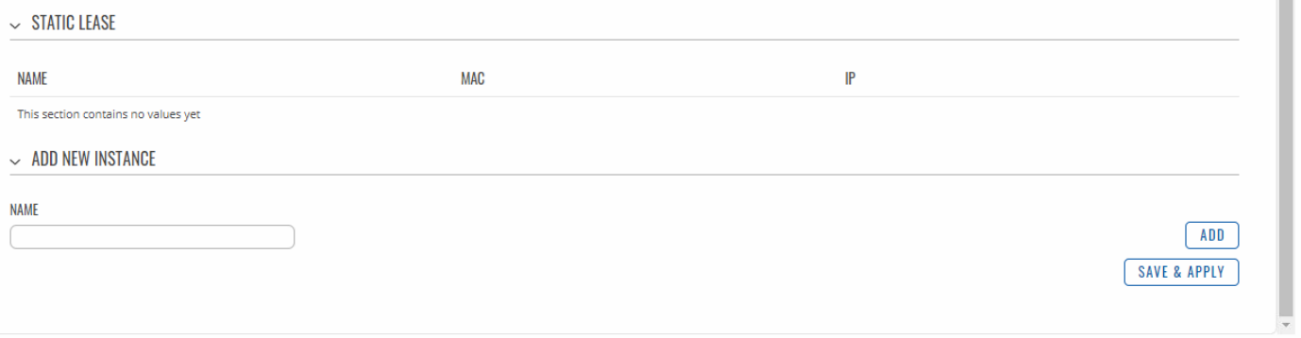
Figure 32: Interfaces LAN (Bottom part of this display)
As the interface IP address has now been changed from the units default 192.168.1.1 the interface will then become unusable, the CU’s IP address will now need to be reset for example 192.168.100.xxx so you can reconnect to the unit. The next step is to refer to the approved system documentation to ensure the correct ip address has been set for the (CU) Control Unit.
Config Import and Export
A preconfigured config can be imported into the unit. It’s important the config is compatible with the unit’s model number and firmware version. Notice in the example file name bellow; Green: Model No - Blue: Firmware Version - Red: Date Created.
Example: V03020-RUT9XX_R_00.06.00.3_2019_03_27.tar.gz.
From the System tab go to Administration and Select Backup. From here simply choose between restore or download config. Note: When downloading a config, please follow the naming convention as shown in the example above.
- Go to System
- Select Backup
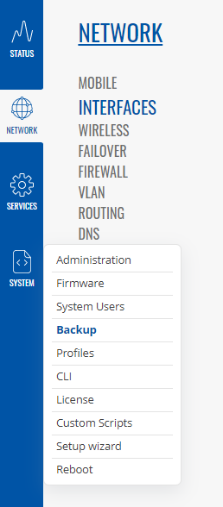
Figure 33: System Config Export
- Go to Backup Configuration section, then select Download
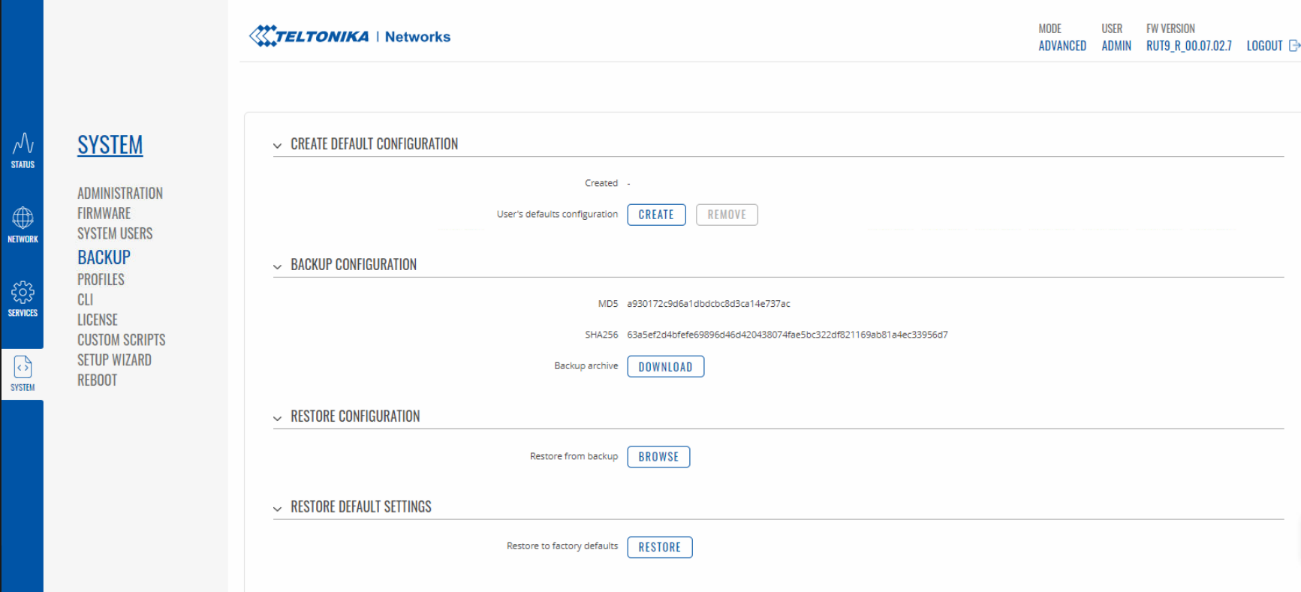
Figure 34: Backup Configuration Download
Firmware Import and Upgrade
- Navigate to System tab
- Next navigate to and then select Firmware
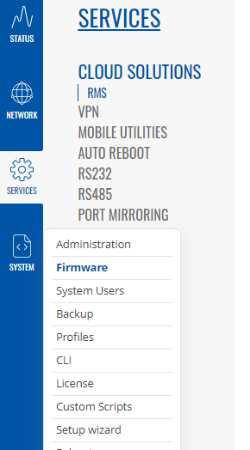
Figure 35: System / Firmware Menu Location
Select Upgrade from file from the dropdown box, then Choose File. Choose the required firmware file, example (RUT9XX_R_00.07.02.7_2022_11_27.tar.gz) and click Update.
We always recommend re-adding the required configuration settings when upgrading the firmware as we have seen lot of config corruption issues in the past.
- Select Update from File
- Keep settings selection box to OFF
- Find the source of the firmware to be installed via Image and Browse
- Locate the file and then select Open
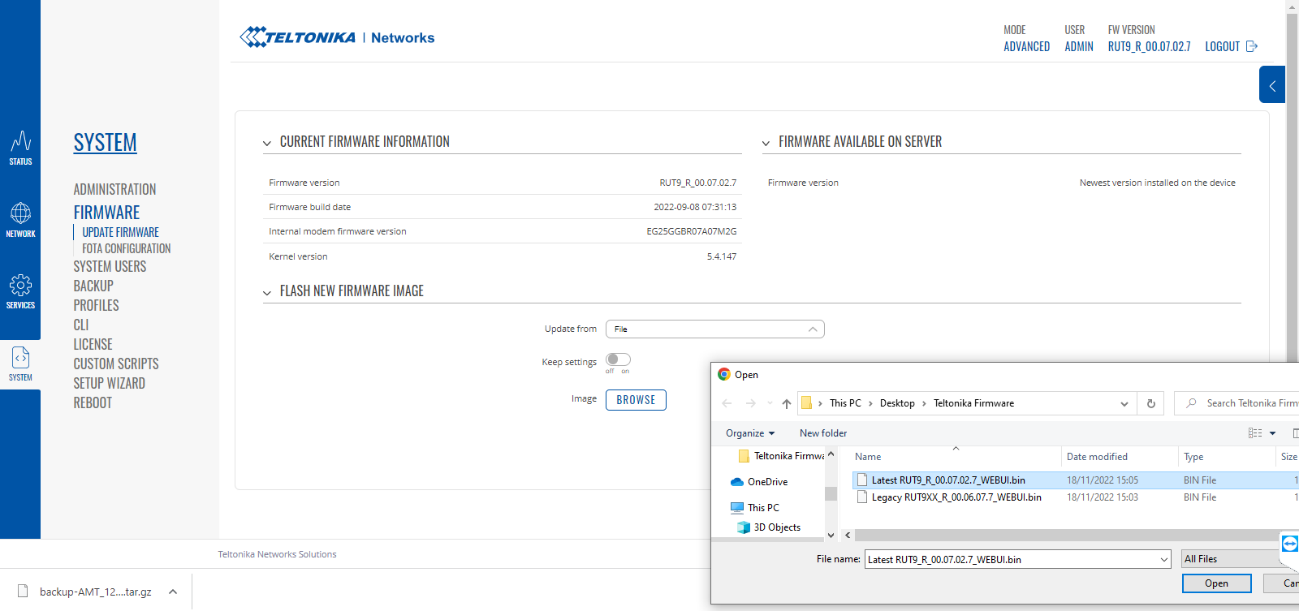
Figure 36: Select and Upload Firmware File (.bin)
The modem will reboot for about 30 seconds, it would be a good idea to setup a test ping so you know when the unit has rebooted, after rebooting the unit will then be usable with its new firmware.
Tested Firmware files (.bin) can be found in Huddle here:
Syncing CU / System to Modems NTP
To configure a CU to use the modem as an NTP time source, do the following. In Windows search type “date & time”, then press enter. Select “Additional date, time & regional settings”, then “Date and Time”. Select “Internet time”, then “Change setting”. Type the modems IP address in the server box and select “update now”. The CU’s time zone can be set to the region it’s in.
Troubleshooting
The modem has capacity for two SIM cards. This is to provide redundancy if one of the cards were to fail. Note: If another card were to be added the unit would need a reboot.
-
If access to the control unit is inaccessible via the webpage control this could be because the logon password has been input incorrectly on multiple occasions. If this is the case, then change the IP address of your CU to an unused IP address. Log in to the Teltonika unit, navigate to System>Administration>Access Control and remove the blocked IP address. After removing the blocked IP address change the IP address back to the original IP address. This can be done remotely if the CU has internet access.
It will also be useful to check the settings as per Figure 25*.*
-
The modem has capacity for two SIM cards. This is to provide redundancy if one of the cards were to fail. Note: If another card were to be added the unit would need a reboot.
-
If the Teltonika unit is sending messages but messages are not being sent from the OS6 Software, firstly check that SMS has been licensed, if this does not resolve the issue then check that SSH settings have been enabled in the General tab as detailed in Figure 24 and disabled in the security tab as per Figure 25.
-
If the modem isn’t behaving as expected there is a systems overview page. This can be accessed by logging into the modems web interface and selecting Overview (2) from the Status tab (1).
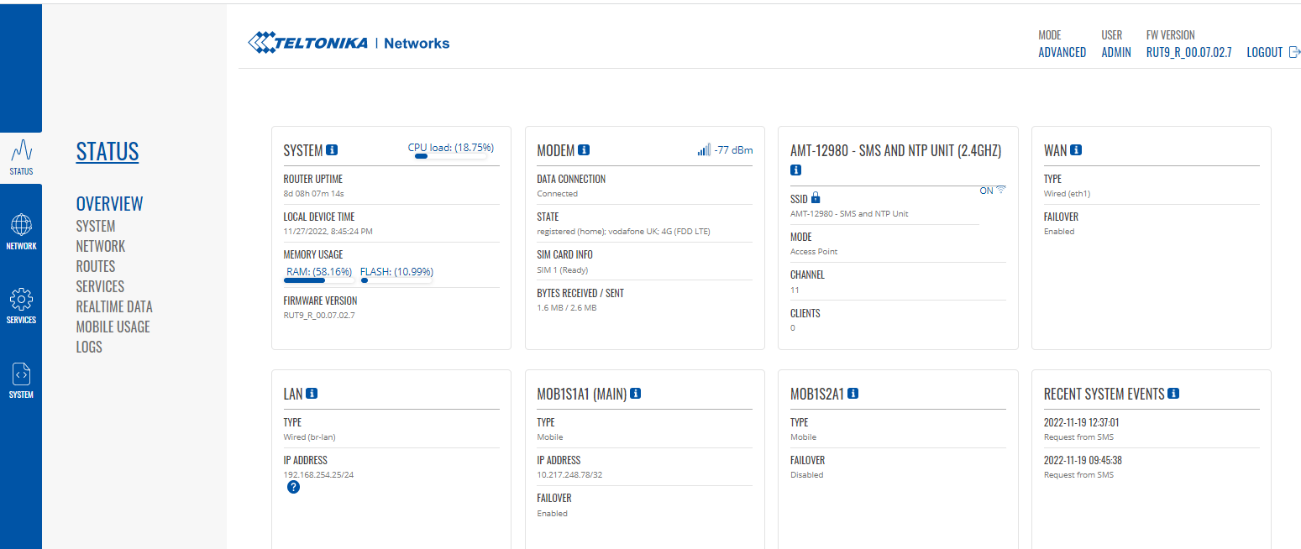
Figure 37: Status, Overview window
Setting up SMS in OS6
The External Comms process will need to be loaded into the system. For information on how to add a process into the software, see Module 12.
From the software toolbar, go to the Configure menu and select External Communications. Select the Email. If the External Communications menu isn’t available, please refer to Module 6 Section 2 - you will need to be logged in as a superuser to make this change.

Figure 38: External Communications
In the Configuring SMS Service box enter the IP address of the Modem (this will be the address of the Teltonika RUT955) and the Username/Password**.** The Username is always “root” and the password is the password of the RUT955 (usually OptaAdmin01). Then click test connection
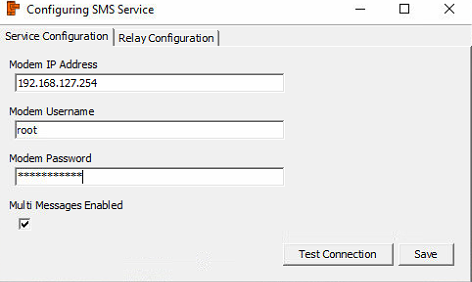
Figure 39: Adding Modem to System
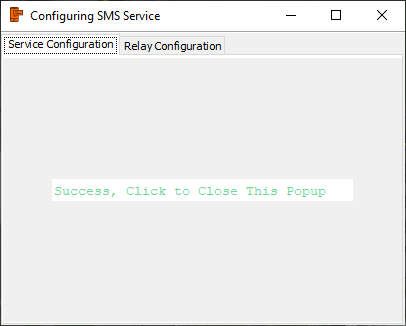
Figure 40: Successful connection
After a successful connection test, a message will appear confirming that. Click anywhere to go back to the settings box and click save.
To access the address box, go to Configure then External Communications and select External Comms Address Book.
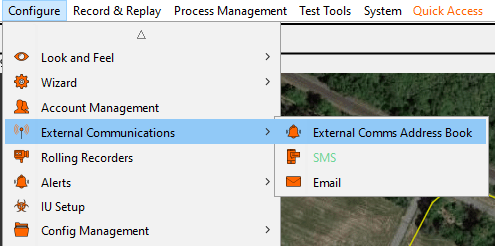
Figure 41: Address Book
To add a mobile number to the address book, right click in an empty space within the address book area and select Add Entry.
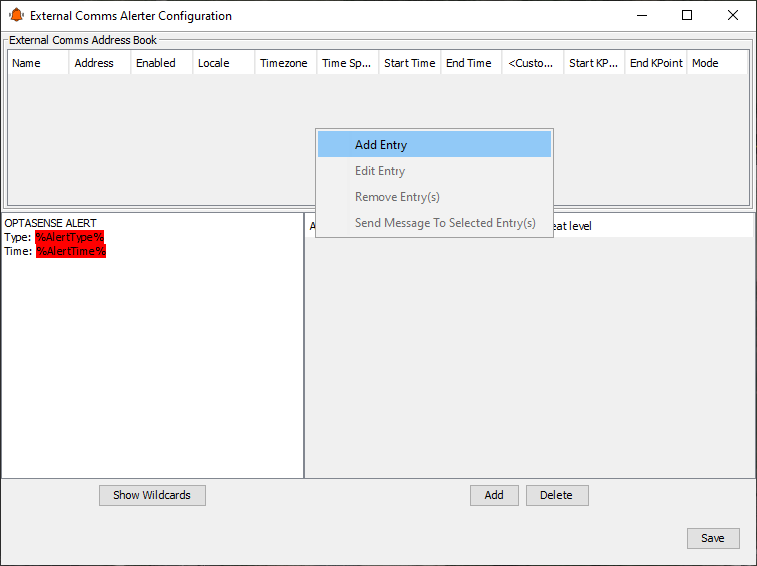
Figure 42: Adding Address Book Entry
In the Add Entry box, enter a name in the name field, followed by the mobile number that the notifications will get sent to. Make sure the Enabled checkbox is checked. Press ‘Ok’.
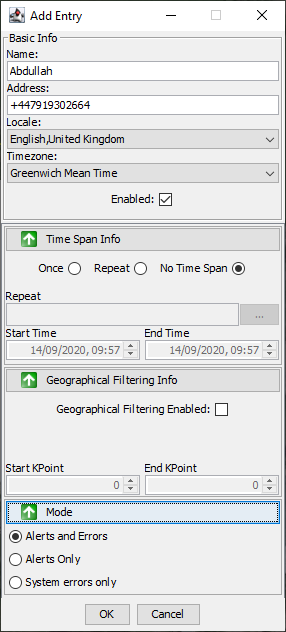
Figure 43: Adding name & mobile number to address book
Phone Numbers should be added in their local number format, unless they are sending internationally.

Figure 44: Phone Number (Correct Input)

Figure 45: Phone Number (Incorrect Input)
Mobile Number Compatibility
- As you will note the phone number has been added with a prefix +44 as shown in the figure above. If you send a real system alert (generated from OS6) to a phone number with the prefix +44 (for example) the message will not send and will crash the modem. A power cycle of the SMS unit is required to reset this issue after the prefix +44 (for example) is removed from the External Comms Address Book.
- If you send a test text message from the External Comms Address Book to a phone number with the prefix +44 for example the message will be sent from the SMS unit.
- If you need to add an international phone number, you can add this by adding the number in this format: 00447825000000
- The underlined numbers denote the Countries Code (44 Being the UK). A comprehensive list of Area codes can be found here: https://countrycode.org
In the Alert type box select add. Then select what type of alerts and its severity should be forwarded to address book entries. Note: multiple entries can be added.
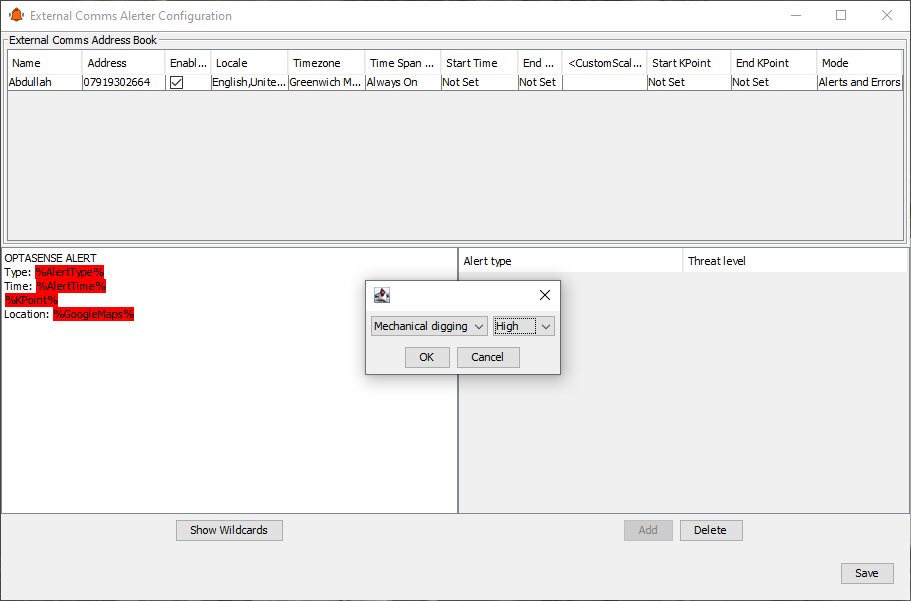
Figure 46: Adding type of Alert to SMS
To refine information contained in the notification SMS, Select Show Wildcard. This will provide a list of cards that can be added to the system. For example, using the card would provide a map link in any sent SMS’s. If the recipient was to click on the link, they would be shown a point on a map of where the alert was generated. To add a wildcard, simple copy and paste it from the Wildcards box into the Alert Message Text box. Alternatively, it can be typed. To apply all the settings in this section, make sure Apply All is selected.
Email Interface
The External Communications Controller will need to be installed via the System Description Editor. For information on how to install this, refer to Section 2.
Software Setup
The email interface has been designed to communicate with external systems and users via email. The interface can be configured to store a set of users and then assign specific actions to each user. For example – users can be set up to receive various levels of alerts and system errors. Email interface runs directly on the node which means that there is a requirement for the node to be connected to some form of internet to allow emails to be sent.
Configuring the Interface
From the software toolbar, go to the Configure menu and select External Communications. Select the SMS. If the External Communications menu isn’t available, please refer to Module 6 Section 2 - you will need to be logged in as a superuser to make this change.
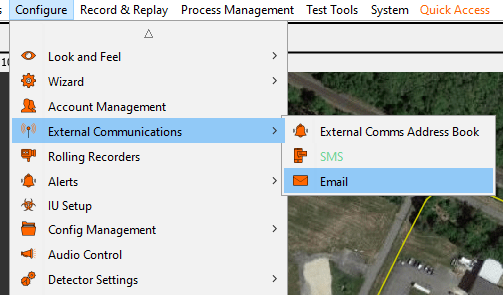
Figure 47: External Comms Configuration Dialog
Once the “Email” button has been selected a window will appear.
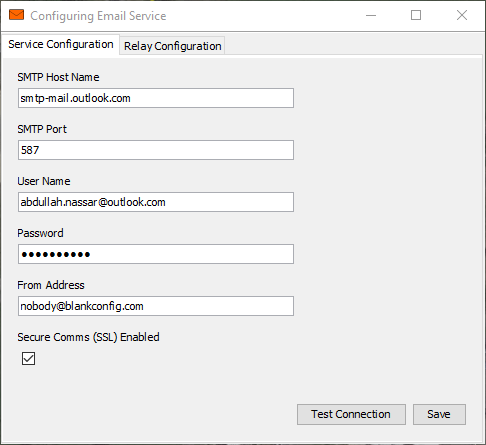 If the PU has direct access to the internet, the service can be configured to talk directly to an external third-party SMTP server, If not and only a CU has internet access then email can be configured to be relayed to the CU first and sent from there. The service configuration below is the same in either case.
- SMTP Host Name: Host address of SMTP server.
- SMTP Port: Port number used by SMTP server to receive email.
- UserName: Host username.
- Password: Host password.
- From Address: Senders email address.
- Secure Comms (SSL) Enabled: Offers upgraded encryption of mail if SMTP server supports it.
Note: The “Test Connection” button only confirms that the SMTP server host and port are accessible from the machine running the External Comms Interface (or CU when in relay mode). It does not test that the credentials are correct.
Also Note: Gmail and Outlook.com (Hotmail) email address do not work well for testing email functionality, both services are becoming increasingly difficult to send SMTP email messages through. Ideally, an outgoing email server and credentials should be provided by the customer.
Email Relay
For installations where PUs do not have access to the internet, emails to be sent can be relayed via a CU. Select the “Relay this service to a CU” box to enable this feature and enter the IP address of a CU to use. Any CU in a system will be running the background service required and will be able to perform this function.
The IP of the current CU will be populated by default, this can be changed if required. In the case of CUs with multiple IP addresses, care should be taken to ensure that the IP specified here is contactable by the PUs in the system.
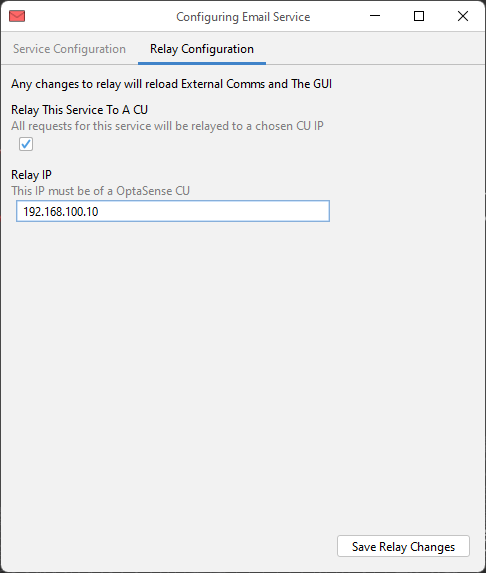
Figure 49: Email Relay
Configuring Email Address Book
Contacts can be created in the address book using email addresses. Currently a separate contact needs to be created for one person’s email address and mobile phone number if both the SMS feature and Email Interface are being used. The following steps need to be followed to configure email addresses:
-
Within the Address Book Entries section, right-click and select “Add Entry” from the External Communications Dialog.
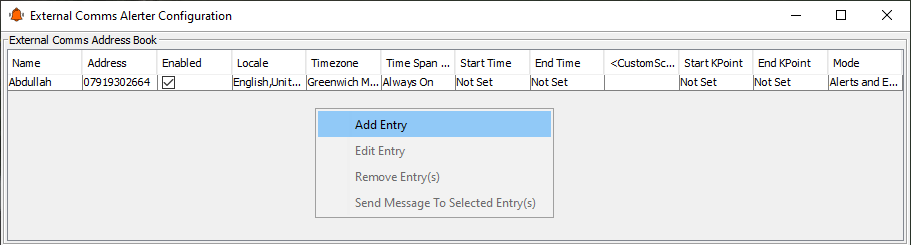
Figure 50: Address Book Entries Window
- This will open the “Add Entry” window within this window all information needs to be added for the contact. Error! Reference source not found.Figure 48 details an example configuration for an email address.
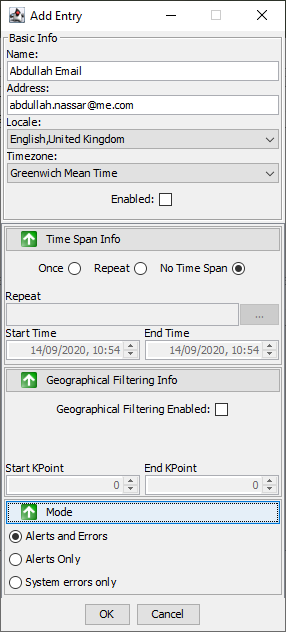
Figure 51: Add Address Book Entry
- Ensure the “Enabled” check box is checked if the email address is to be used.
Setting Alert Types
The last step is to configure which alert types are to be reported via email these options will be limited to the activity types specified in the current software build. The following steps need to be followed:
- View the current alert types in the “Alert Type” panel in the “External Communications Dialog”.
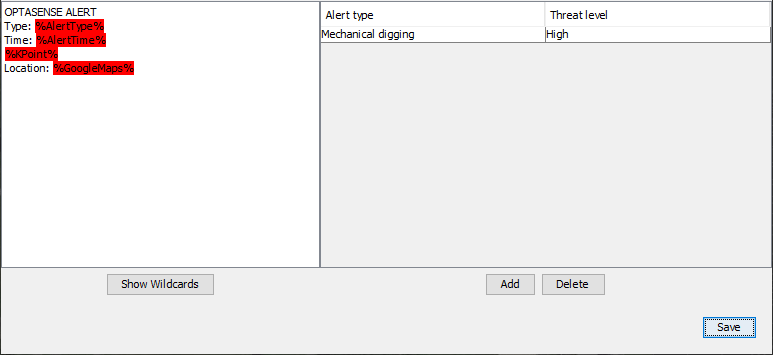
Figure 52: Alert Type Panel
-
The “Alert Types” can be deleted by left-clicking on the “Alert Type” followed by left-clicking on the “Delete” icon.
-
The “Alert Types” can be added by left-clicking on the “Alert Type” this will bring up the alert selection window. Within this window the activity type can be selected via the first dropdown box and the alert type (low, medium or high) via the second drop down box.
NOTE: Only one type of alert can be selected at a time, e.g. only one instance of the Leak Detector can be present not a High Leak Detector and a Medium Leak Detector.

Figure 53: Alert selection window
-
The final option in the “External Communications Dialog” is the “Alert Message Text” this should remain as the defaults for the FAT but can be configured before SAT to meet any requirements for the client. By selecting the Show Wildcards, additional items can be included in the message text, such as a Google Maps link to the location and the client specific KP using the syntax shown in Figure 51.
The text in the Alert Message is free text and can be modified as required for the client, the wildcards can be copied from the Wildcards window and pasted into the Alert Message or can be typed using the syntax %Wildcard%, i.e. %AlertType%.
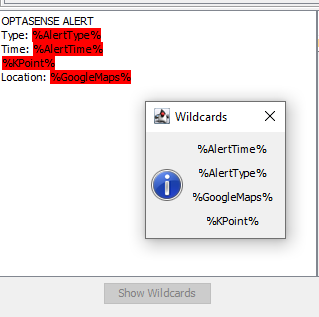
Figure 54: Selecting History Window
System Health Diagnostics Reporting
A diagnostic report can be run to provide an overview of the systems health. There are a few things that need to be setup for this to happen.
Note: To use Diagnostics Reporting, it needs to be licenced.
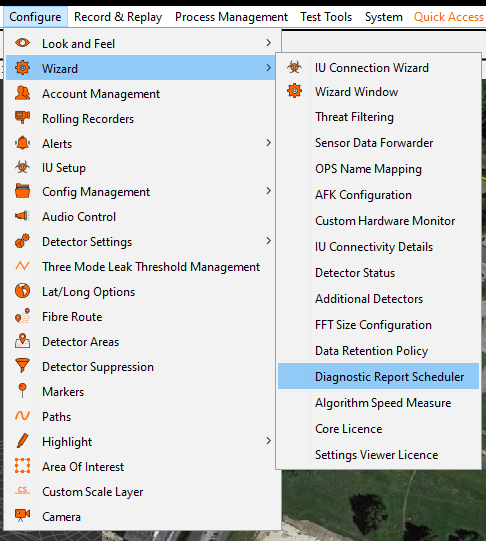
To run a report or check when the next auto report is due, go to the Historical Analysis menu and select “Diagnostic Reports”
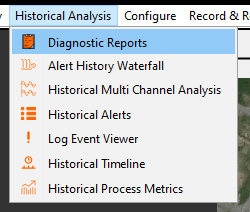
Figure 55: Diagnostics Reports Window
To run a report, select the required date and click “Generate”.

Figure 56: Generating a new report
Select the required location of where the file will be stored. Click save to compile the report.
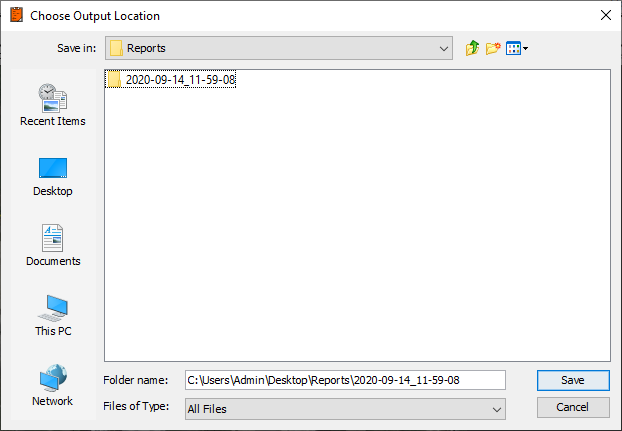
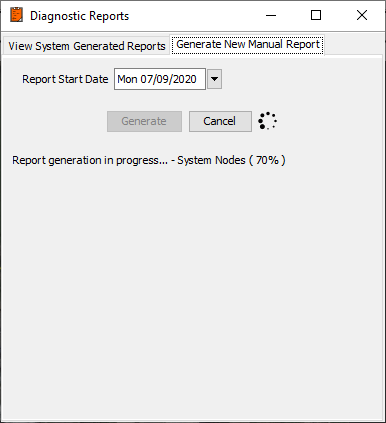
Figure 57: Saving Diagnostics Report to a Location
The report will automatically open in the CU’s internet browser. If it doesn’t, navigate to where the report is stored and open the file “Health Report” as either .HTML or .XML format.
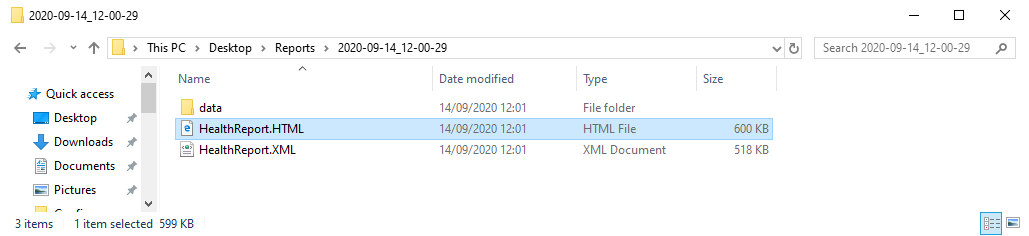
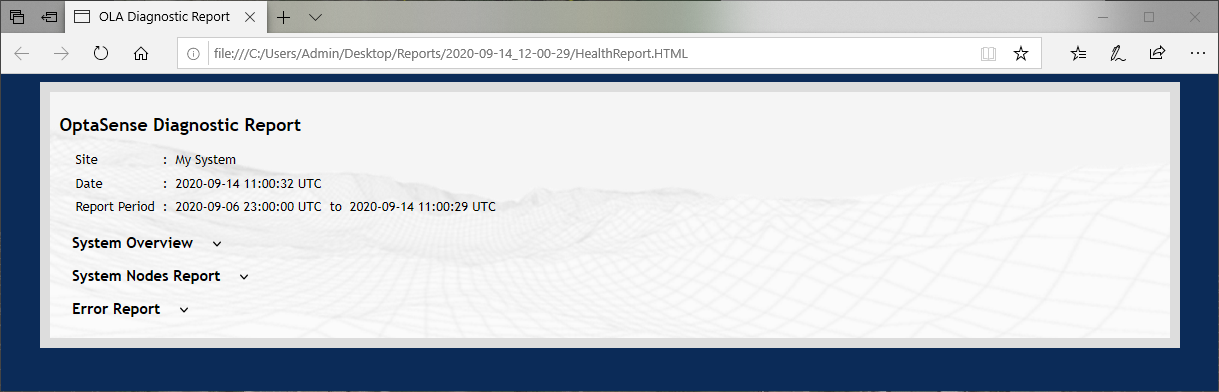
Figure 58: Opening Diagnostics Report
Forwarding Diagnostics Reports
Reports can be forwarded to email recipients. The recipient will need to be on the email contact list. For information on how to add a contact, refer to section 4.34. The type of email account also needs to be considered. For information regarding appropriate email addresses, please refer to section **Error! Reference source not found.**5. Also note, to use Diagnostics Reporting, it needs to be licenced.
From the Configure menu, go to Setup Wizard and select Diagnostics Report Scheduler. There are two options that need to set. “Schedule When The system will Make a Diagnostic Report” means how often the system will generate and store reports in its database. “Saved reports will be deleted within the database after” means the limit of time the system will keep reports before deleting them. Selecting finish will commit any changes.

Camera Interface
Prerequisites:
-
The Camera is not installed by default and will need to be added via the ‘System Install Scheduler’ editor.
The interface to add in this editor is the ‘Camera Interface’. Please seek Module 12 which describes the steps of adding a new interface into the system.
-
For the interface to work with a camera, the camera needs to be on the same network as the PU.
Launch the software. From the Configure menu select Wizard then Camera Interface.
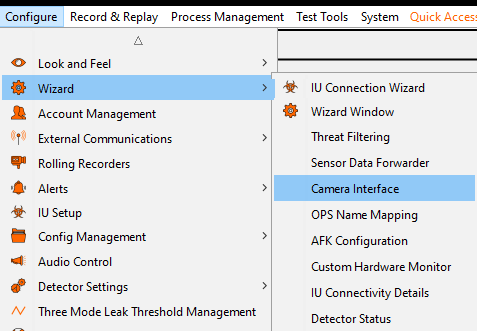
Figure 60: Opening the Wizard Window
From the Interfaces section, select Add New Camera.
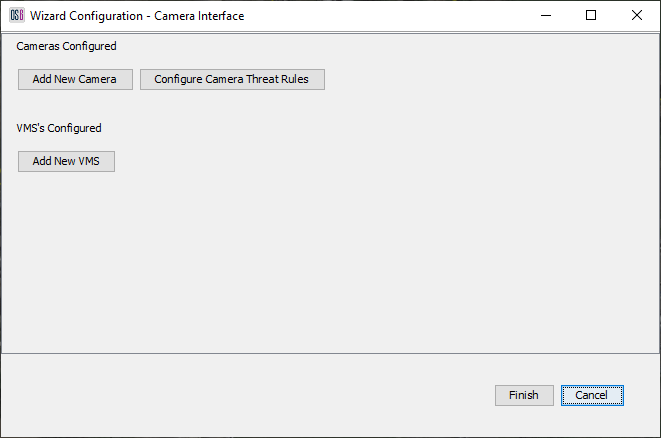
Figure 61: Adding a New Camera
The next box requires details about the camera being added.
- Camera Name: The name displayed to the user of the system
- Camera API: There are two API’s available (PELCO & ONVIF).
- Camera IP Address: IP Address of the Camera.
- Username / Password Fields: Username / Password required to login to the camera’s web interface.
- Latitude / Longitude*:* Is the physical location of the camera geographically and will be the position it gets placed on the system map.
- Cameras Aspect Ratio: can be left as default.
- Deinterlace: Can be checked and may clean up the visual quality in the received camera feed.
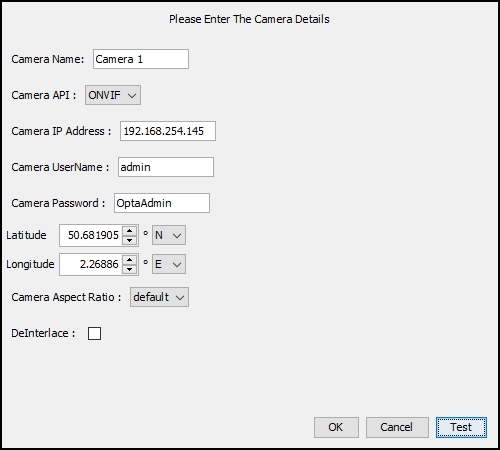
Figure 62: Camera Setup Details
Once the camera added, go ahead and test it. Select Test.
If successful, the following box will be shown.

Figure 63: Camera Test Results
To finish the install, select OK then OK and Finish.
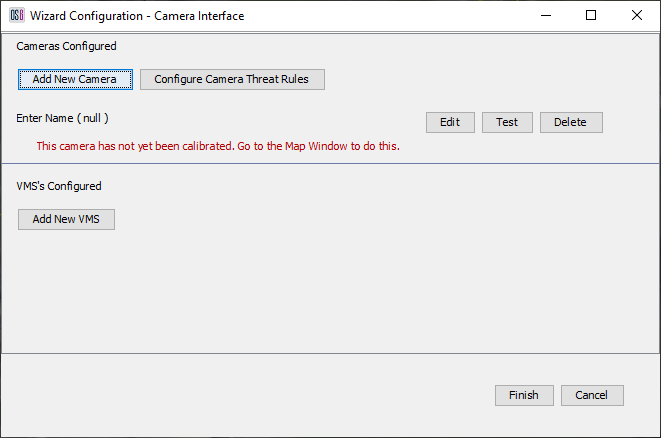
Figure 64: Finishing Camera Interface Install
Calibration
From the Configure menu, select the Camera.
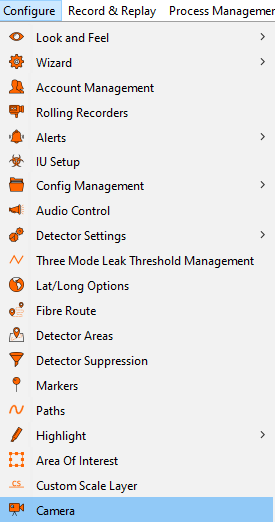
Figure 65: Calibrating Camera
Notice on the Map, there’s a camera icon with a box around it. This means the camera needs calibrating. Right click on it and select Calibrate “Camera Name”.
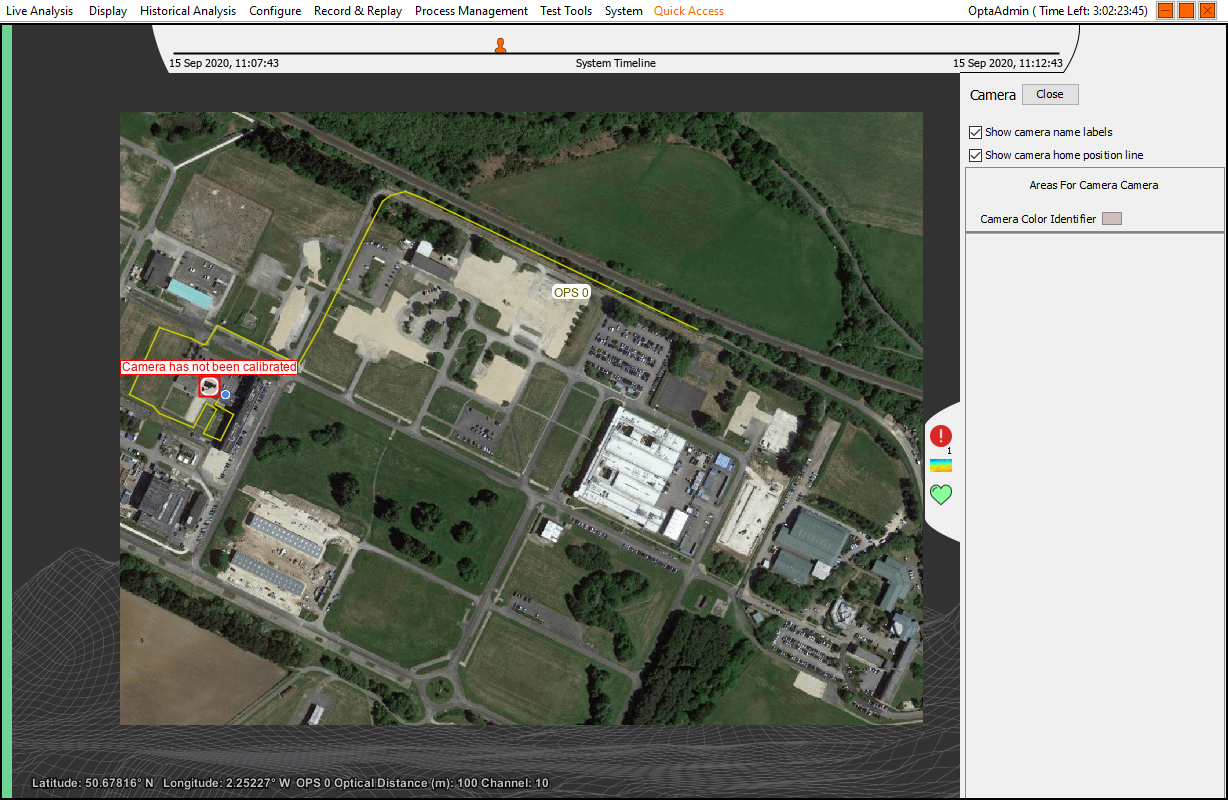
Figure 66: Calibrating Camera
There are two ways to set the calibration position. The first is to set it by entering LAT / LONG coordinates. The second is to manually draw it on the map.
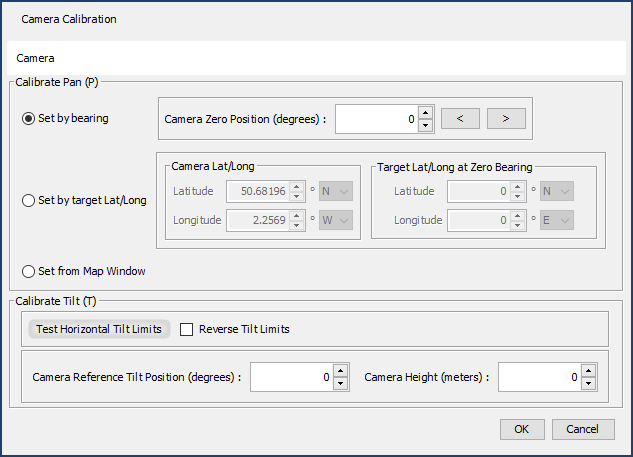
Figure 67: Calibration Options
Setting Calibration Via LAT / LONG Coordinates
Every time the Camera Calibration window is opened, the integrated camera will set itself to its home position. To see this and to get a live feed, from the Display menu select Camera Window.
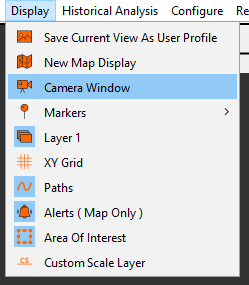
Figure 68: Selecting Live Camera Feed from Toolbar
Selecting the Manual radio button will provide a live feed to the camera. If you have added more than one camera, these can be selected from the dropdown box.
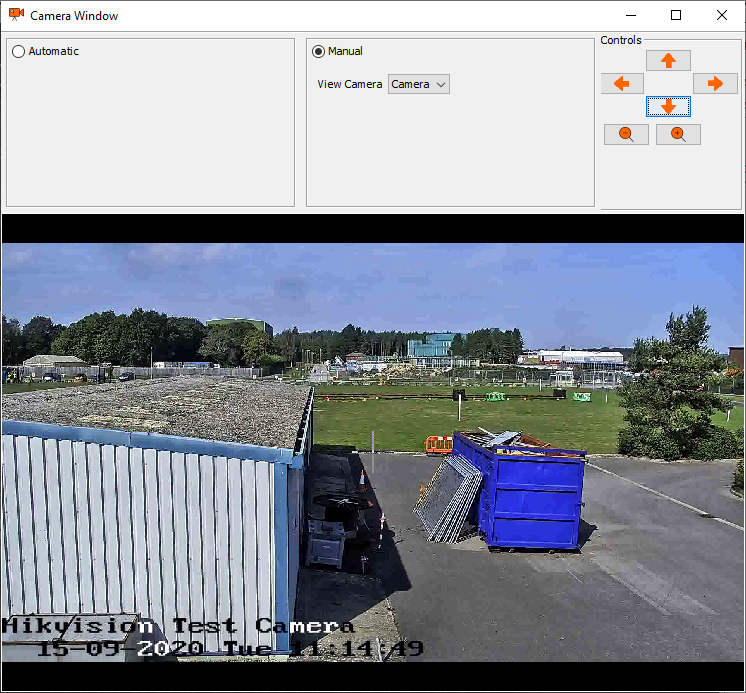
Figure 69: Live Camera Feed Window
With the camera in its home position, visually pick a spot in the middle of the image at least 50 meters away. As per red circle in the figure above. Now physically go to that location and take the Lat/Long coordinates. Those coordinates need to be inputted into “Target LAT/LONG at Zero Bearing” fields.
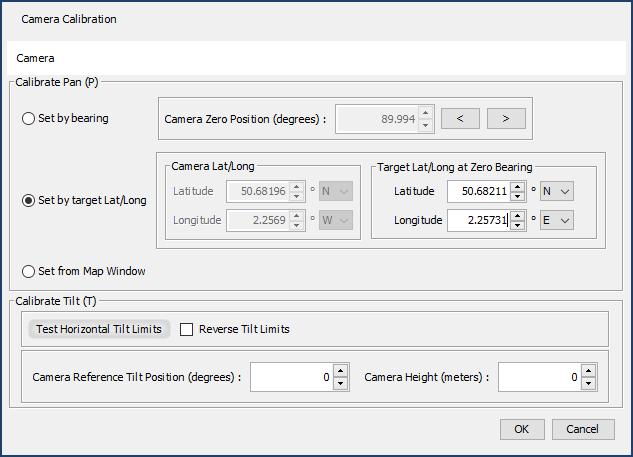
Figure 70: Calibration Options
Selecting ok will calibrate the camera but first it’s important to consider the following settings.
- Set by Bearing: Allows the cameras home position to be offset left or right. This is useful if the cameras hardwired home position is inconveniently situated. Therefore, a more convenient position can be set, which in turn enables a calibration point to be set relative to the new home position.
- **Calibrate Tilt: “**Test Horizontal Tilt Limits” - This will force the camera to its full minus tilt position. Notice on the live camera feed, the angle is displayed. This can help to determine an appropriate value to input into the “Camera Reference Tilt Position” field. Setting a value here will be the tilt position for a given area. (Areas are covered in section Creating Camera Areas). “Reverse Tilt” - Changes the cameras tilt position to positive.
- Camera Height: This needs to be set to the physical height of the camera.
Setting Calibration Via Drawing on Map
Providing the map and fibre route have been geographically referenced, the calibration point can be drawn on the map. From the map window right click on the Camera and select Calibrate “Camera Name”.
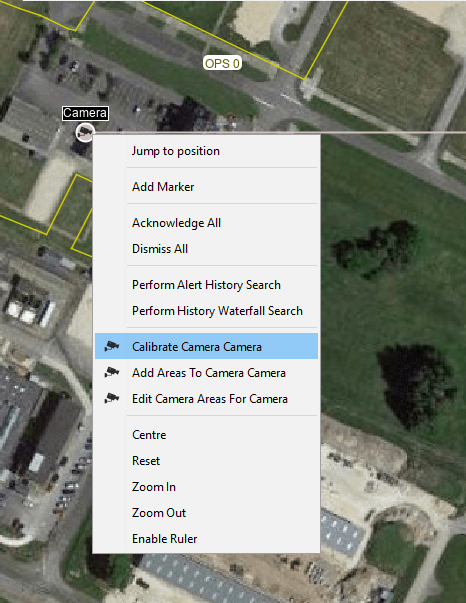
Figure 71: Selecting Calibration from Map Window
Select “Set from Map Window” and select ok

Figure 72: Calibration Options
With the calibration window open, select on the map where you want the calibration point to be positioned. Select ok to confirm the position.
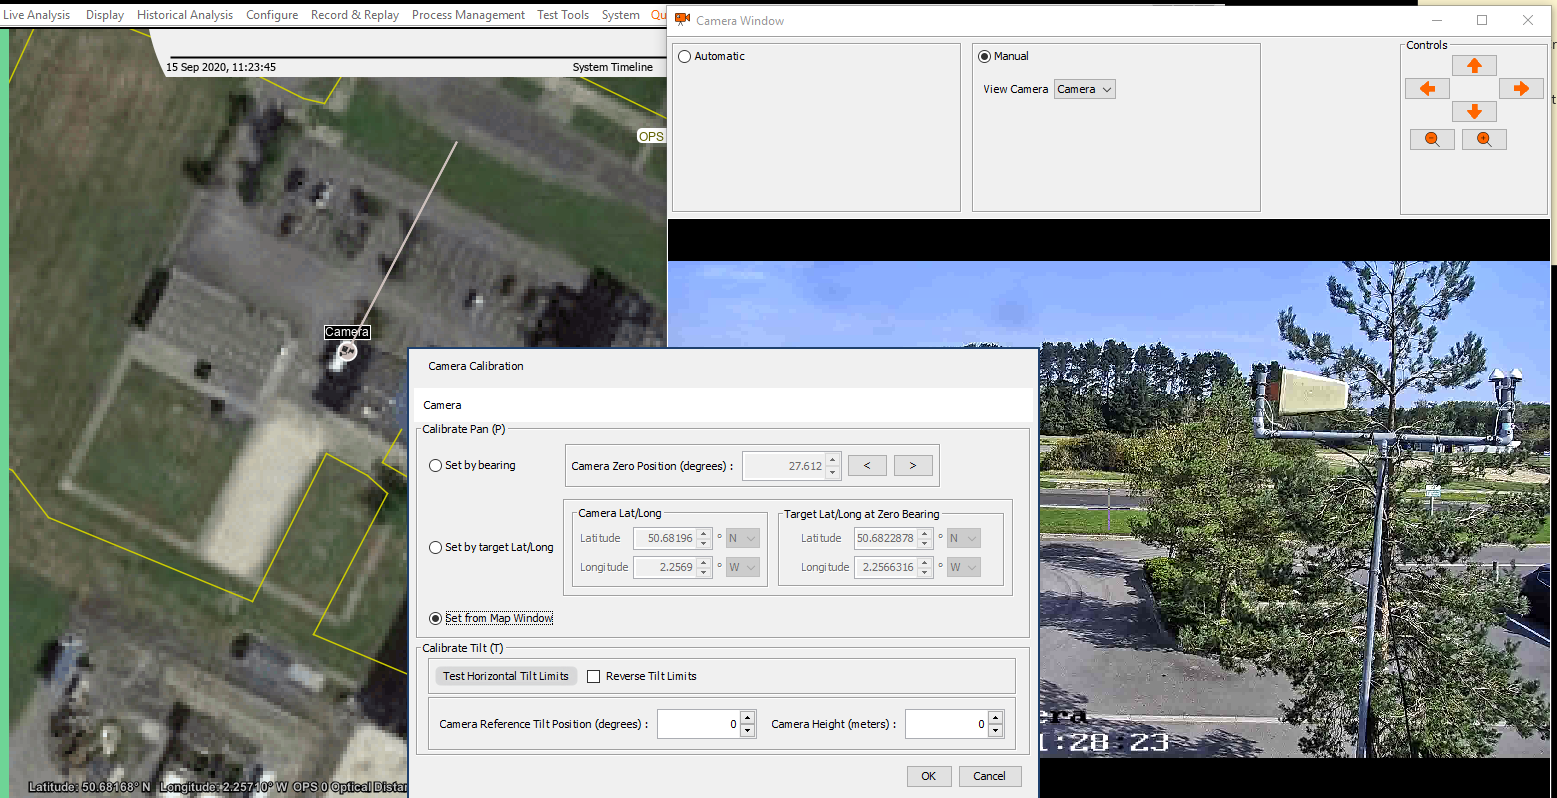
Figure 73: Drawing Calibration Point
Creating Camera Areas
On the map window right click on the camera icon and select Add Area To “Add Areas to Camera Name”.
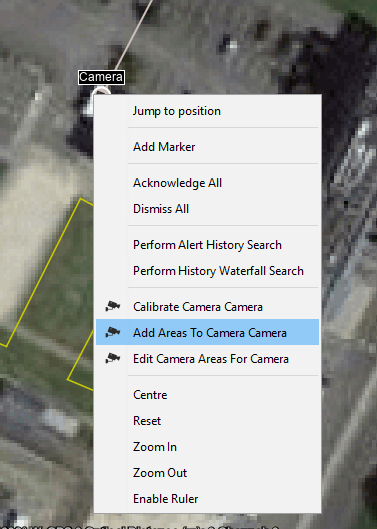
Figure 74: Add Areas to Camera
Now draw an area over the section of fibre you want the camera to cover.
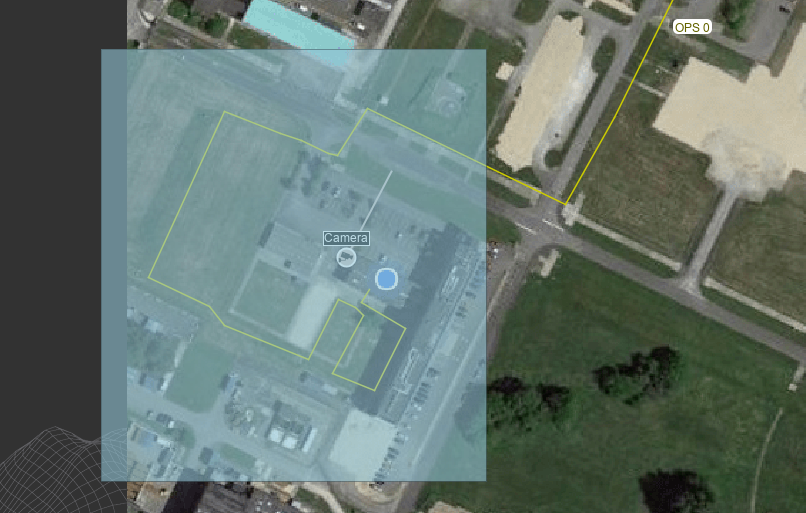
Figure 75: Drawing Camera Area
The settings in the “Areas for Camera” window may need to be adjusted to suit the area being setup.
- Area Channel Coverage (Highlighted in red): The zone coverage can be edited manually.
- Set Height: Allows a height to be set for an area. For example, if the camera is X above / below sea level and the area is above / below the camera, obviously there is a difference in height. If the difference is worked out, that amount can be entered.
- Set Zoom: Works like a snapshot. When selected, the cameras zoom will be used for the entire area. To accurately get this to work, one should login to the camera’s web interface, manually set the required zoom and then select “Set Zoom” on the Area for Camera window.
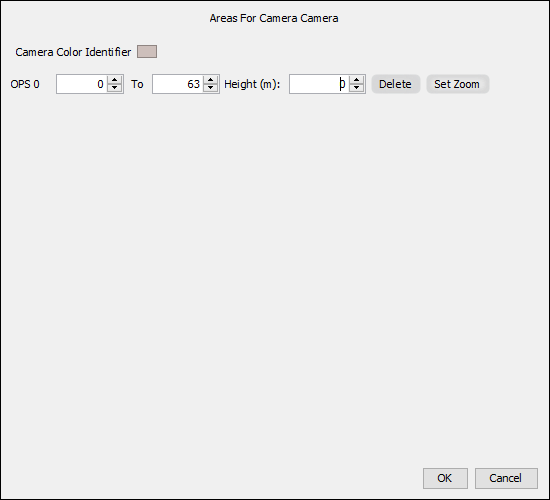
Figure 76: Camera Area Settings
To edit the camera area, on the map right click on the camera and select “Edit Camera Area for Camera”.
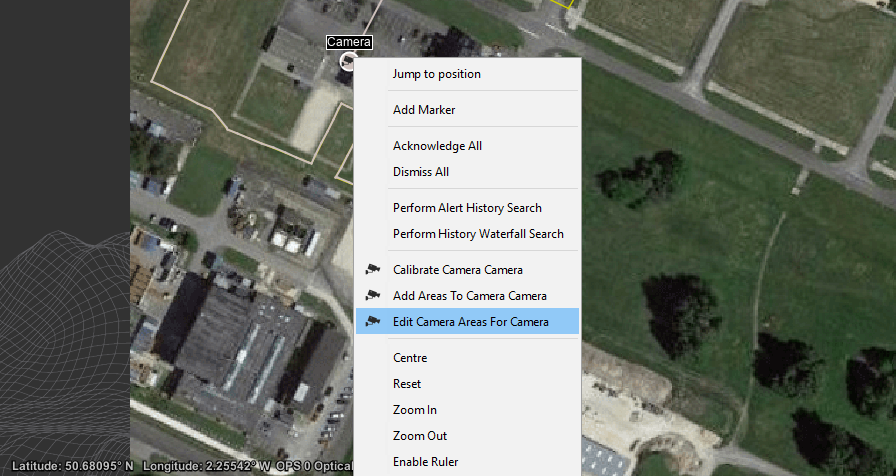
Figure 77: Edit Camera Area
The edit camera box will display all the areas setup for the camera. The numbers highlighted in red represent distance in terms of channels, these can be edited. If “Overlap” is shown, this is because an area overlaps another in terms of coverage. This isn’t necessarily a problem, just an indicator.
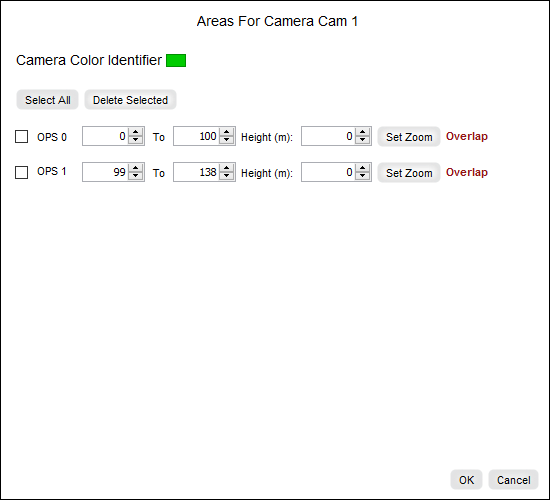
Figure 78: Camera Area Settings
An overview of the camera setup areas will appear on the right-hand pane while configuring, this can be opened anytime from Configure menu and selecting Camera.
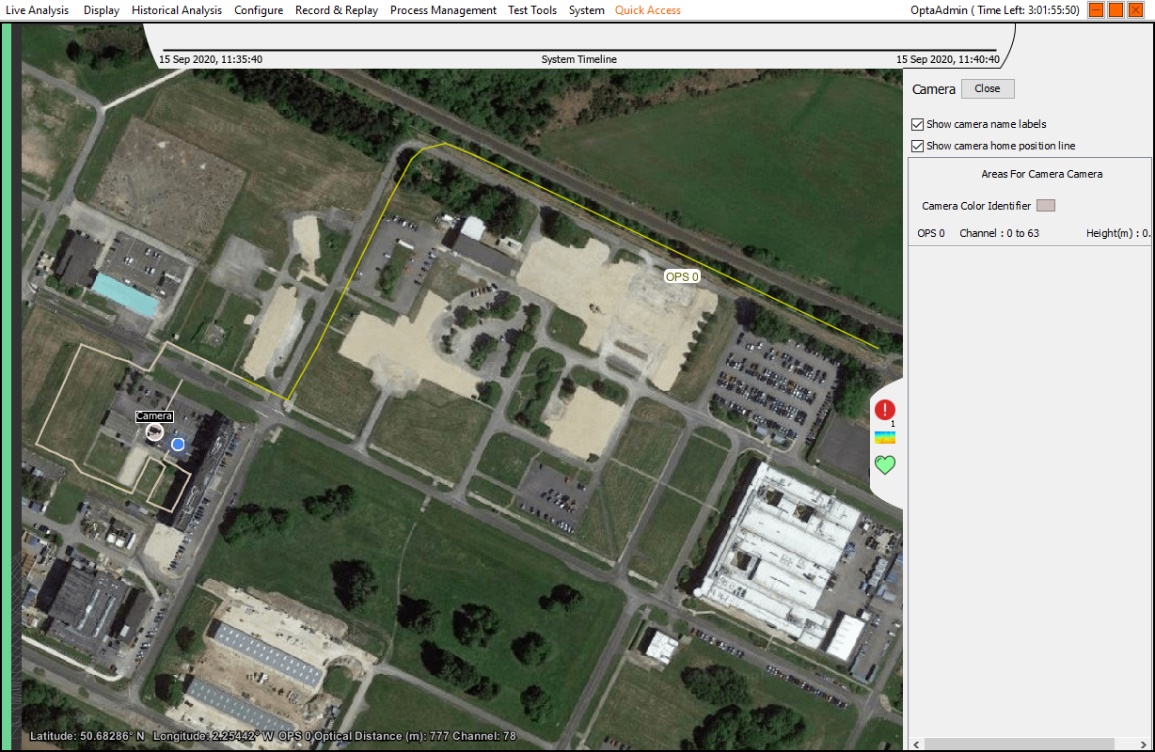
Figure 79: Camera Overview
VMS
There are two ways in which VMS can be setup.
VMS Setup 1
The concept of setup 1 is that the VMS receives the commands, logs it and drives the camera / s.
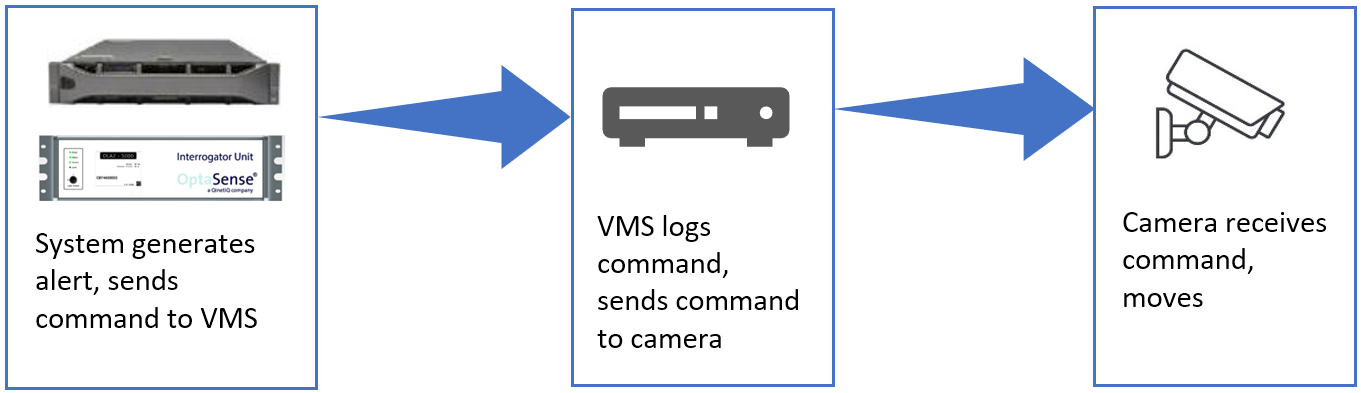
Figure 80: VMS Setup 1
VMS Setup 2
The concept of setup 2 is that the OS drives the camera and VMS logs the commands.
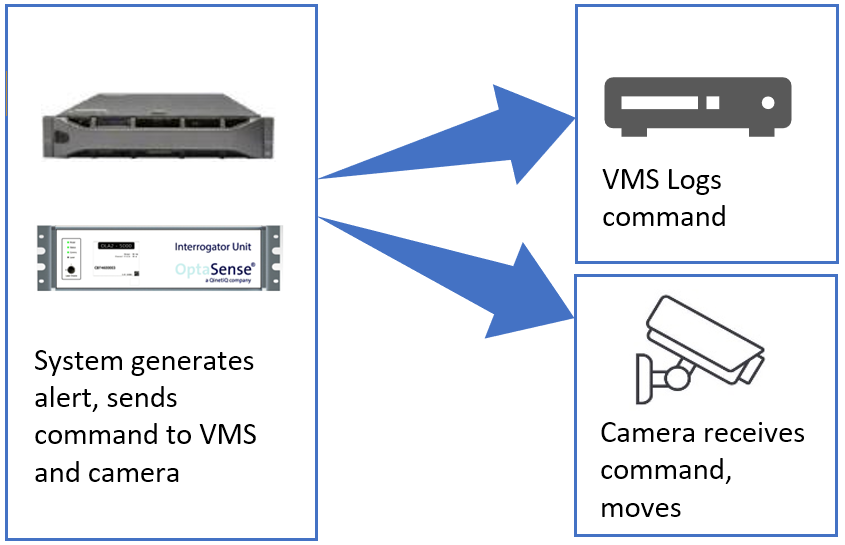
Figure 81: VMS Setup 2
VMS Setup 1
Prerequisites:
- The camera interface first needs to be installed via the System Description Editor.
- For the interface to work directly with VMS, the VMS needs to be on the same network as the PU.
Launch the software. From the configure menu, select wizard then Camera Interface.
Figure 82: Camera Interface
From the Interfaces section select Camera Interface. Select “Add New VMS”.
Figure 83: Adding VMS
The VMS configuration box will require details relevant to the VMS.
- VMS Name: The name used to identify the VMS to the users of the system
- VMS: There are 2 VMSs to choose from, Wavestore or Milestone.
- VMS IP address: IP Address of the VMS.
- VMS Port No: Port number of the VMS.
- Username / Password Fields: Username / Password required to login to the VMS.

Figure 84: VMS Details
To finish the installation, select finish.
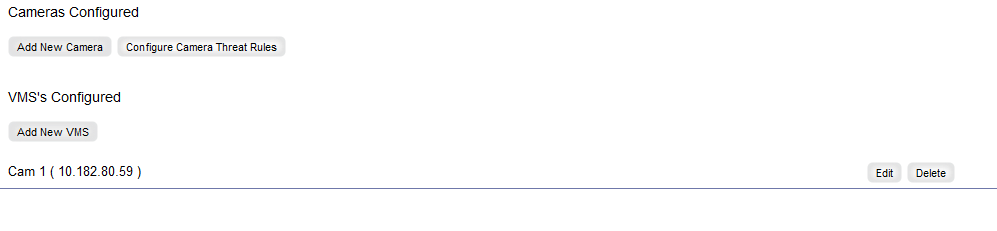
Figure 85: Finishing VMS Installation
To get a live feed of the camera / s, from the Display menu select Camera Window.
Figure 86: Live Camera Feed
Selecting the Manual radio button will provide a live feed. If you have added more than one camera, these can be selected from the dropdown box.
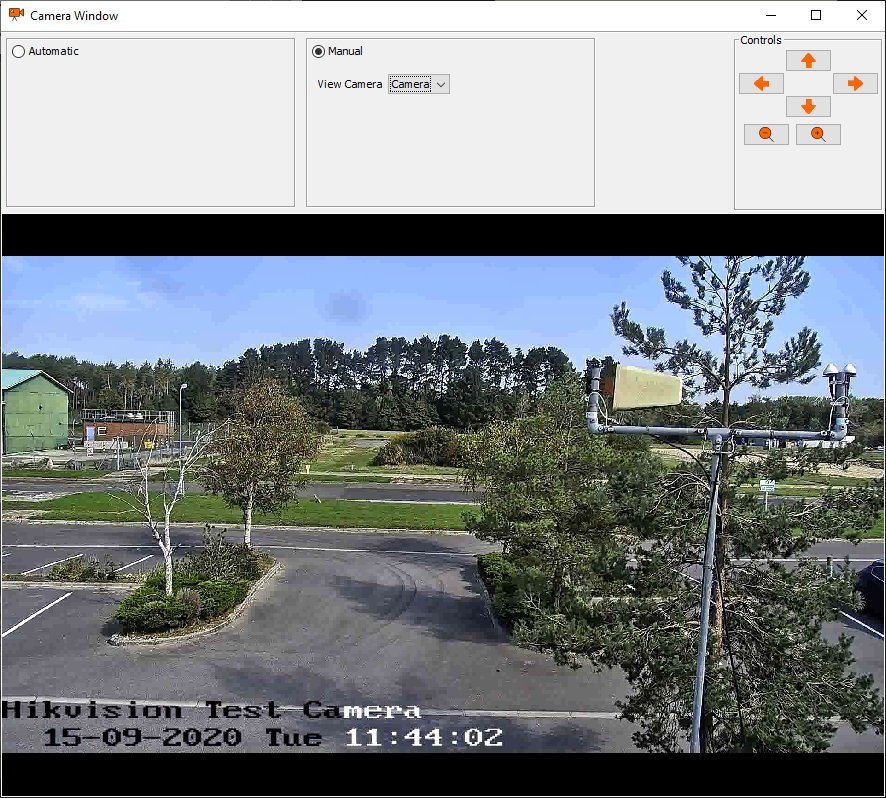
Figure 87: Live Camera Feed Window
To add a VMS area, on the map window right-click and select Add VMS Areas.
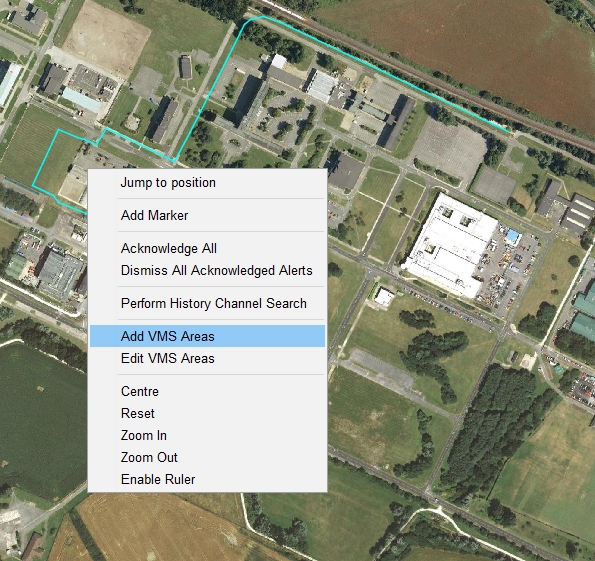
Figure 88: Adding VMS Area
Now draw a box around the required area.
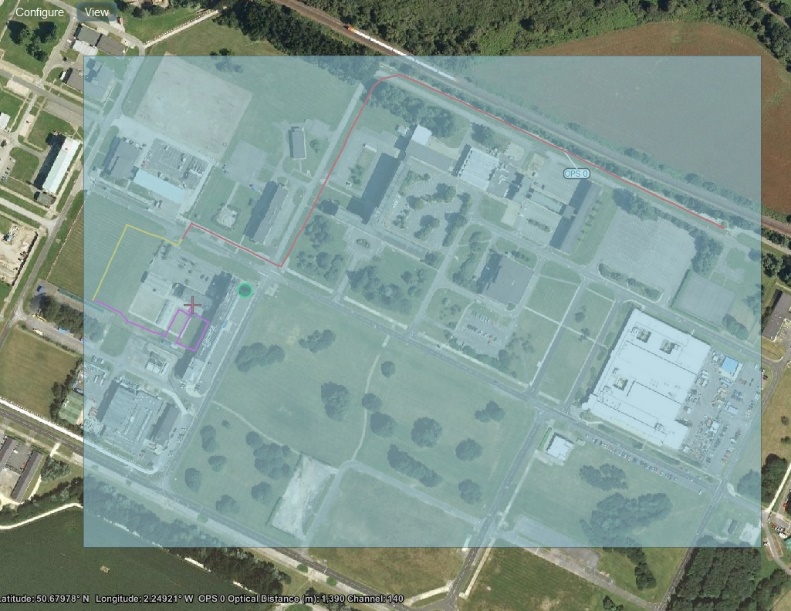
Figure 89: Drawing VMS Area
The settings in the “VMS Zone Configuration” window may need to be adjusted to suit the VMS zone being setup.
- VMS: Select the dropdown arrow to select the desired camera.
- Select Overlaps: Can be used to select all overlapping area instances. An overlap is a zone area that extends into another. It isn’t necessarily a problem, just an indicator.
- Zone Channel Coverage (Highlighted in red): The zone’s channel coverage can be edited manually.

Figure 90: VMS Zone Settings
Select OK to finish the setup.
Note: Now that the OS has been setup to work with VMS / s, the OS VMS areas will need to be mirrored in the VMS. This is not covered in this manual as we cannot predict the configuration of the VMS / s.
VMS Setup 2
Having integrated the required camera/s, the VMS can now be bolted on as a logger.
From the configure menu, select Wizard then Camera Interface. Select “Add New VMS”.

Figure 91: Adding VMS
The VMS configuration box will require details relevant to the VMS.
- VMS Name: The name used to identify the VMS to the users of the system
- VMS: There are 2 VMSs to choose from, Wavestore or Milestone.
- VMS IP address: IP Address of the VMS.
- VMS Port No: Port number of the VMS.
- Username / Password Fields: Username / Password required to login to the VMS.
Figure 92: VMS Details
To finish the installation, select OK.
The setup of getting VMS to log commands is not covered in this manual. This is because we cannot predict the configuration of the VMS/s.
Threat Rules
Open the Camera Interface window from Configure Wizard.
From the Interfaces section, select Camera Interface. Select Configure Camera Threat Rules.
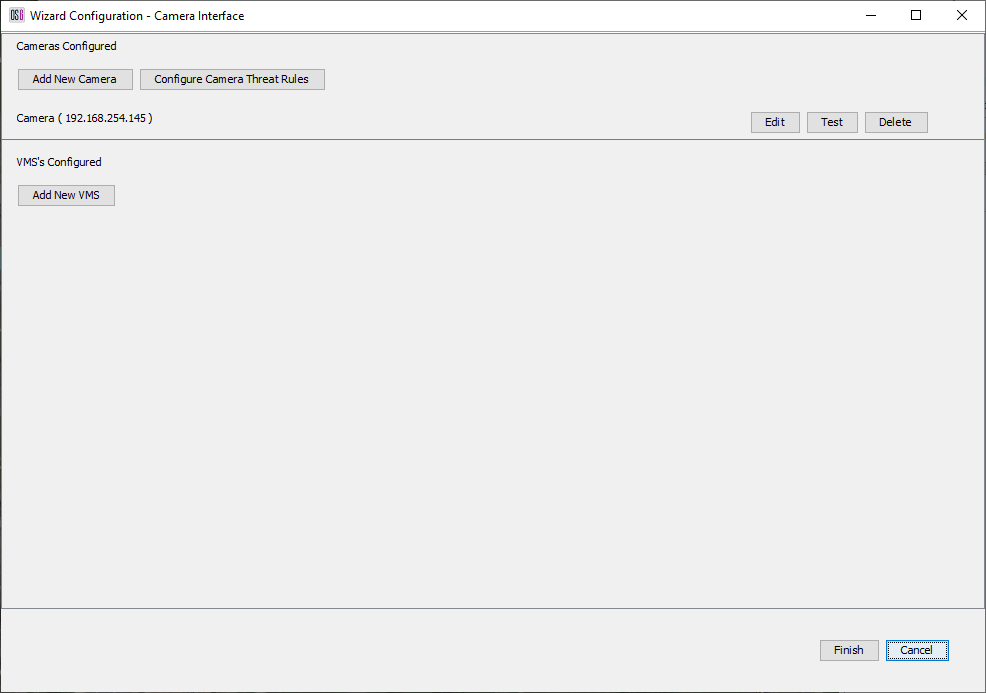
Figure 93: Configuring Camera Threat Rules
Threat rules allow the user to prioritise where the camera will move first in the instance of multiple alerts. Each alert type can be stacked accordingly by dragging and dropping them. The “Add Rule Set to all OPS’s” will apply the threat priorities to all OPS’s. “Set Time to Track” is the time in seconds that the system / camera will track an alert before moving on any other alert type.
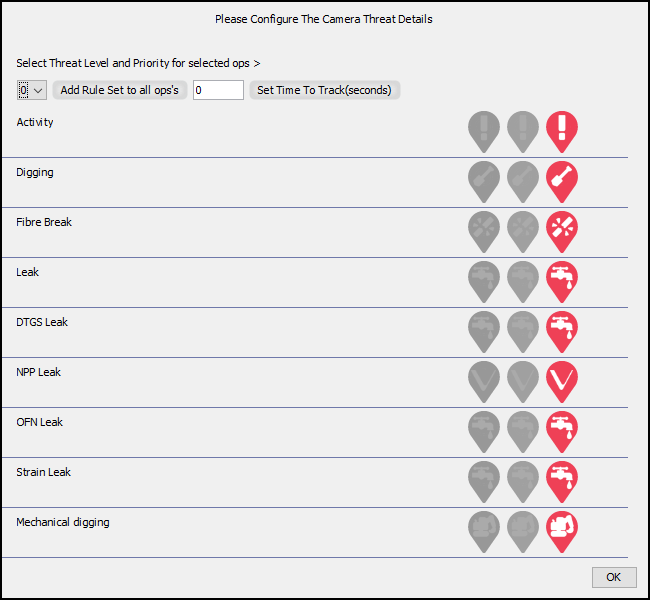
Figure 94: Setting Threat Priority
Milestone Configuration Guide
When you setup the DVR do not use the same Username as the Milestone Server name.
Set the Hostname to the AMT-xxxxx (xxxxx denotes unknown numbers).
Setup the camera presets on the camera.
Open the Milestone XProtect Management Client 2023 R1 (using the blue Milestone Icon with the Cog).
Check that the port is set as per the port in the OptaSense Software (Default 1234).
On the Milestone software set up the firewall to prevent the port from being blocked.
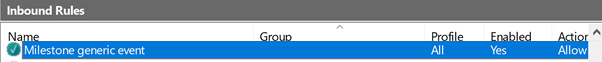
Figure 95 - Add Firewall Rule
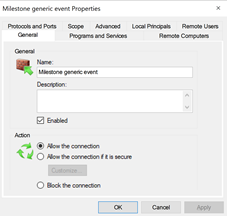
Figure 96 - Firewall Rule Settings 1 of 2
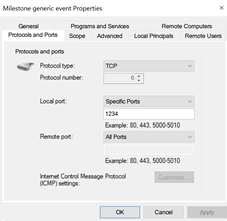
Figure 97 - Firewall Rule Settings 2 of 2
The next step is to set the OptaSense PU (Processing Unit) please note this is not the CU (Control Unit).
Go to Tools then Options.
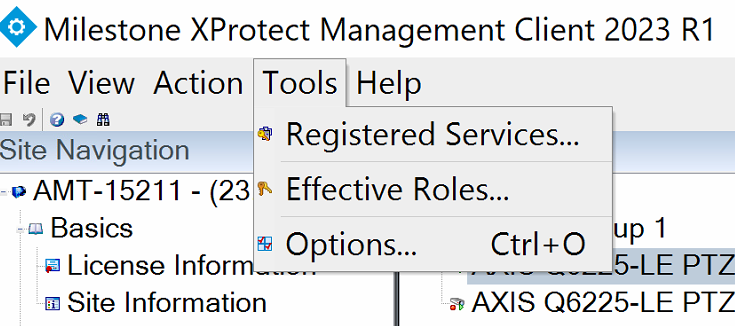
Figure 98 - Milestone – Tools then Options
The next menu is usually hidden off the right hand side if this display, so you will need to use the [ > ] on the right to navigate to the Generic Events tab.
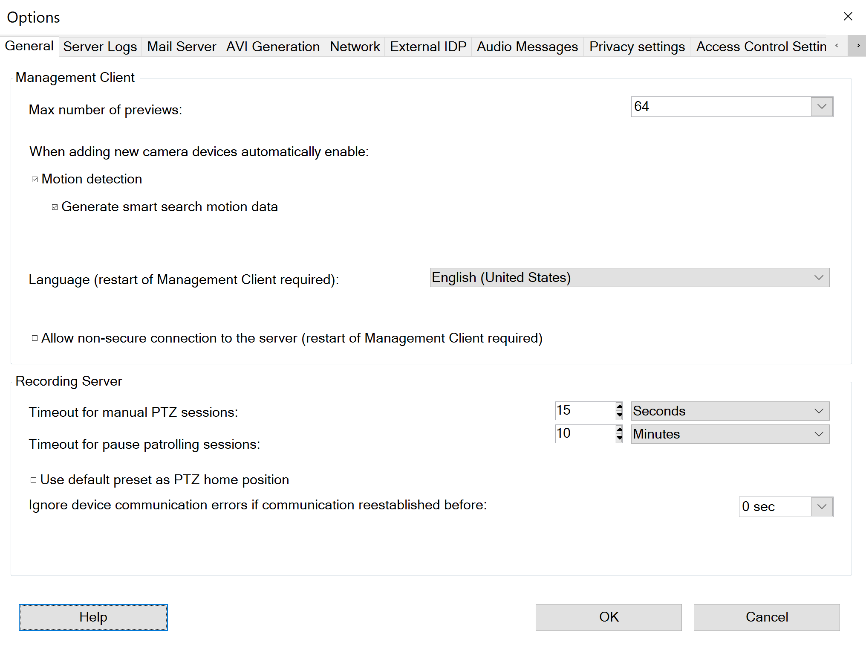
Figure 99 – Milestone Options Menu

Figure 100 - Milestone Options Menu - Generic Events Tab
In the following window set the port number to match the OptaSense OS6 VMS configuration page also set the PU IP address and check that all of the other settings are as per the next reference image:
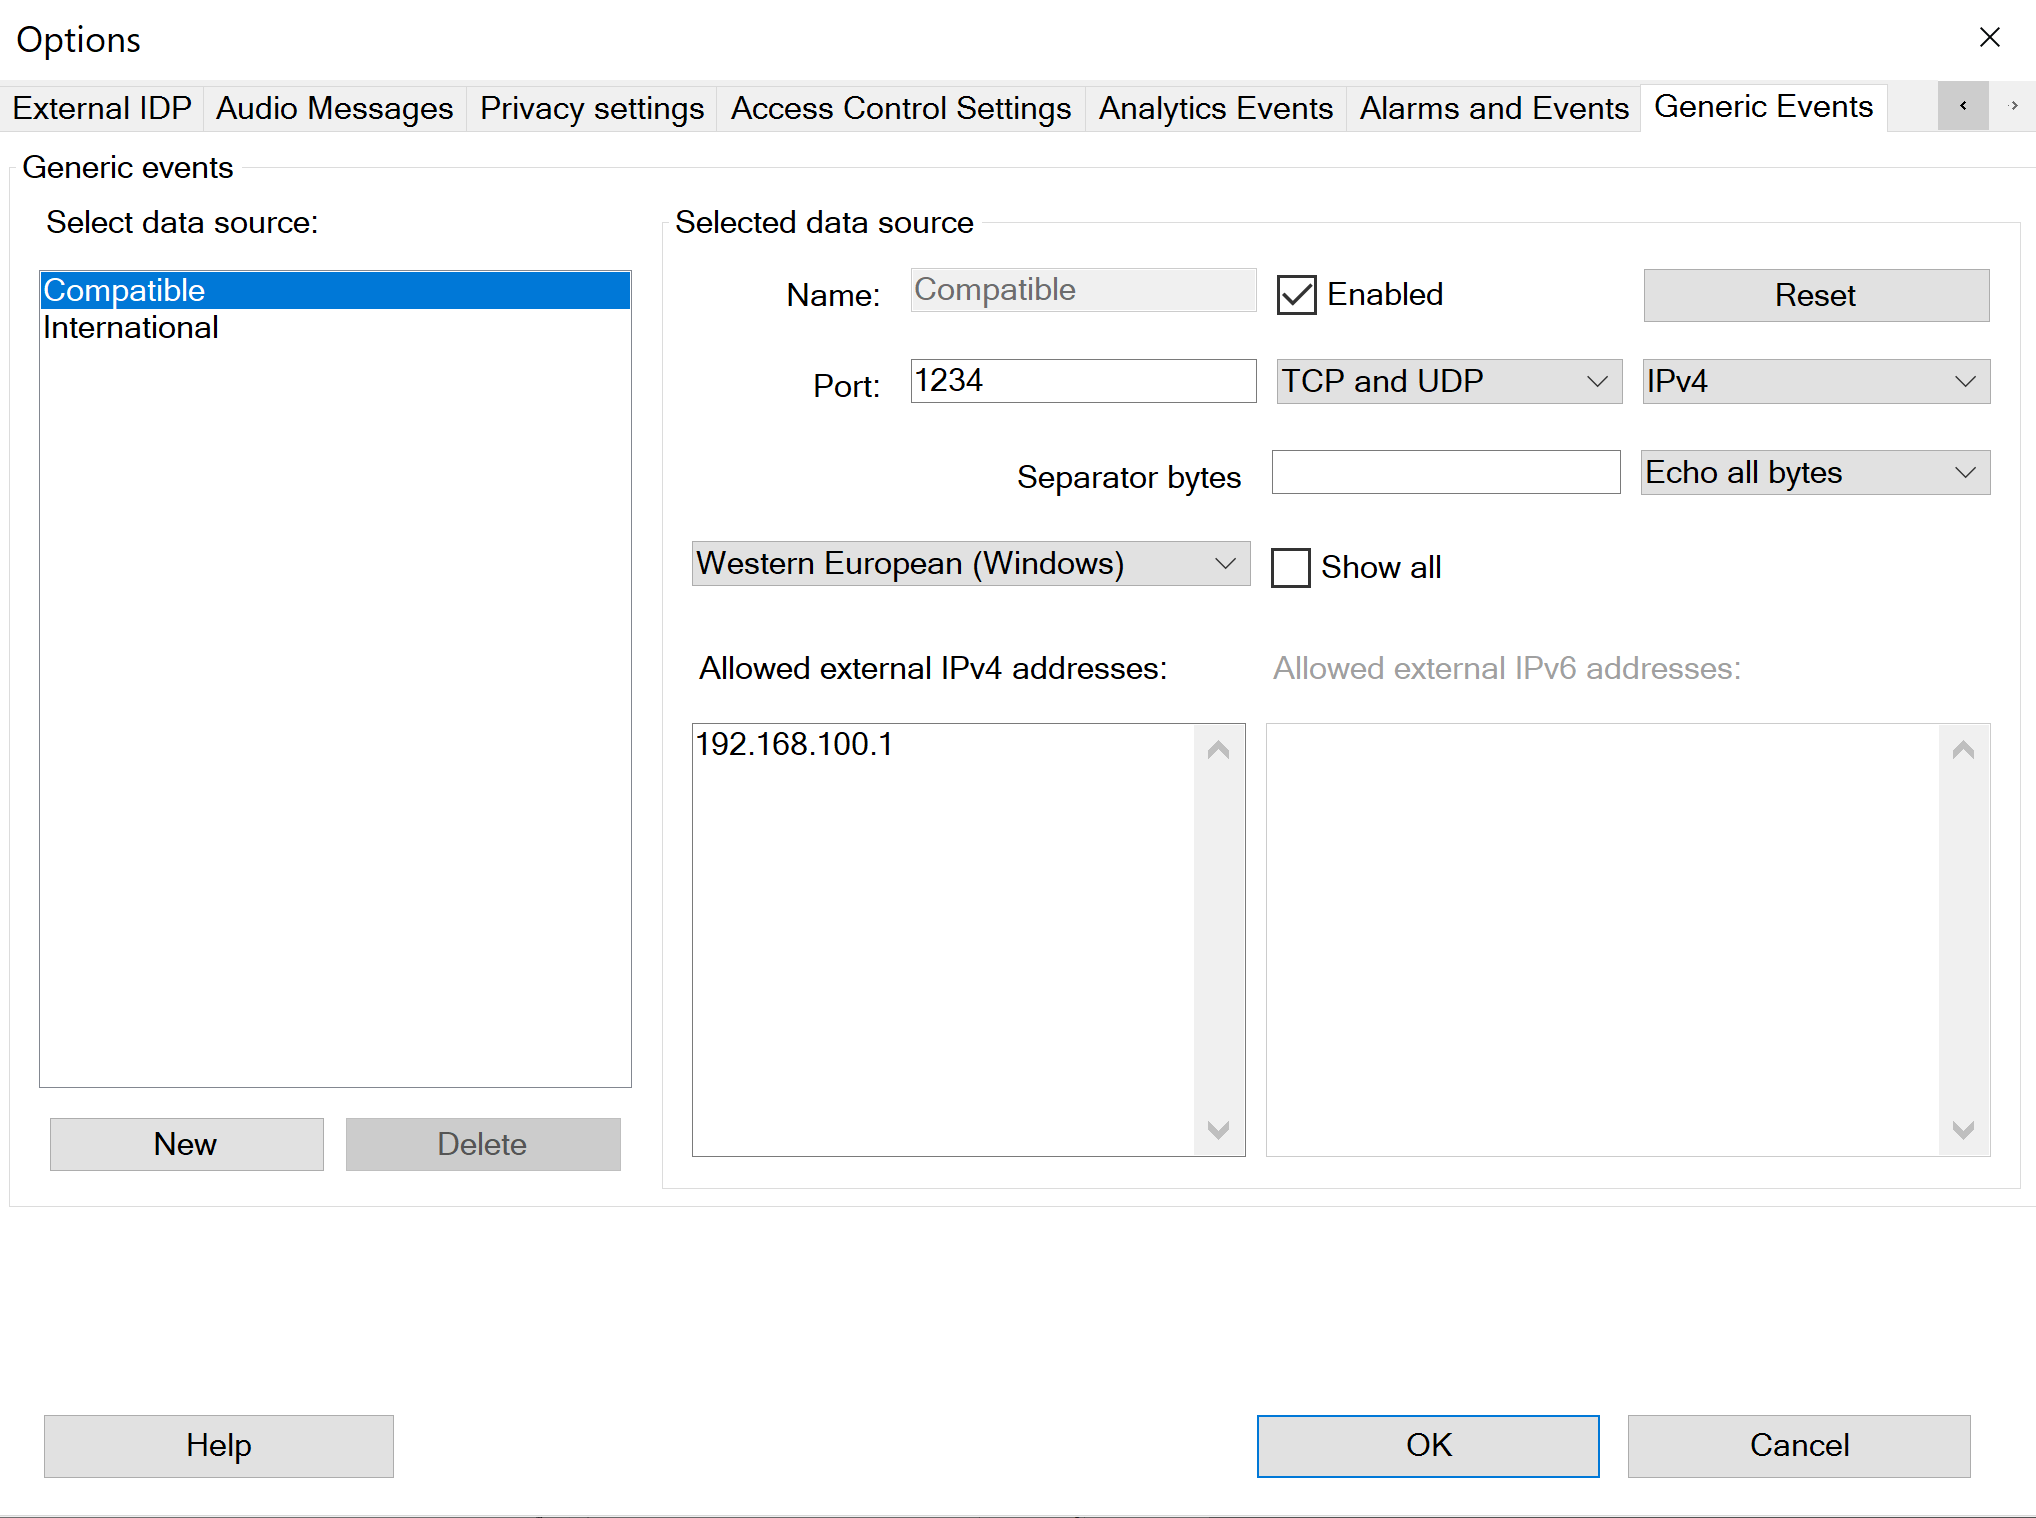
Figure 101 - Milestone Generic Events - Specific OptaSense Settings
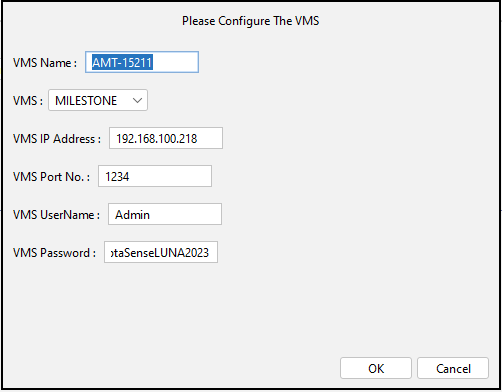
Figure 102 - OptaSense OS6 VMS Configuration Window
Next set the VMS zone / areas in OptaSense OS6 by right clicking and then selecting Add VMS Areas.
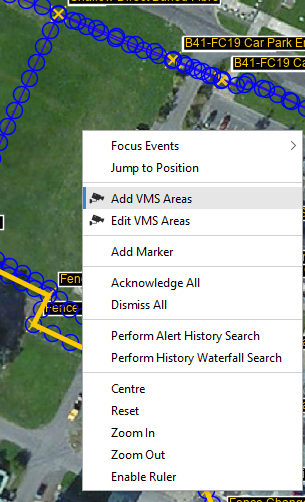
Figure 103 - OS6 Add VMS Areas
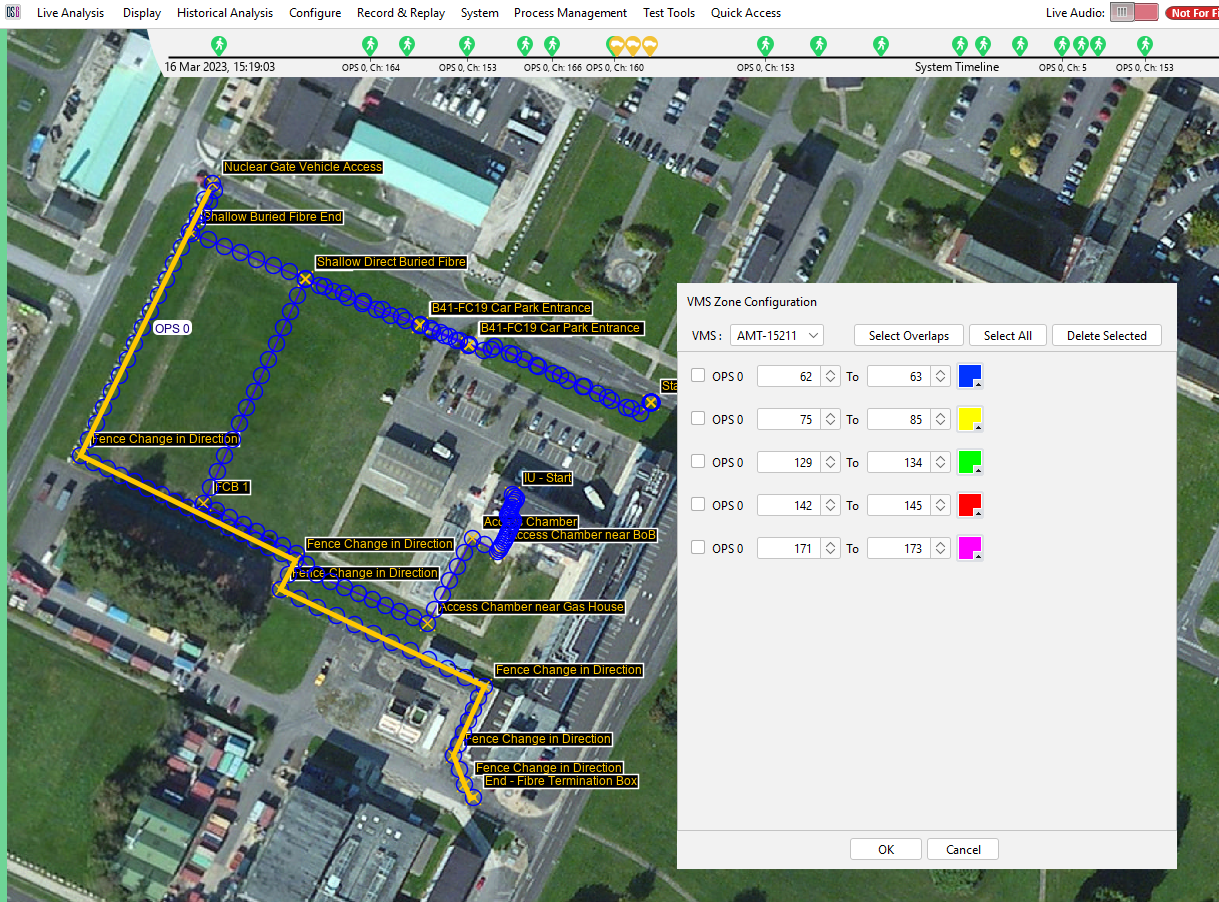
Figure 104 - OptaSense OS6 VMS Zone Configuration Window
Check that the zone start and end channel numbers are the same in OptaSense OS6 and the Milestone setup / configuration.

Figure 105 - Milestone XProtect Management Client
Go to Devices then Cameras under the Site Navigation window, highlighted by the orange box.
After selecting this move to the next window along highlighted by the green box and select the [ + ] on the left side of Camera Group 1.
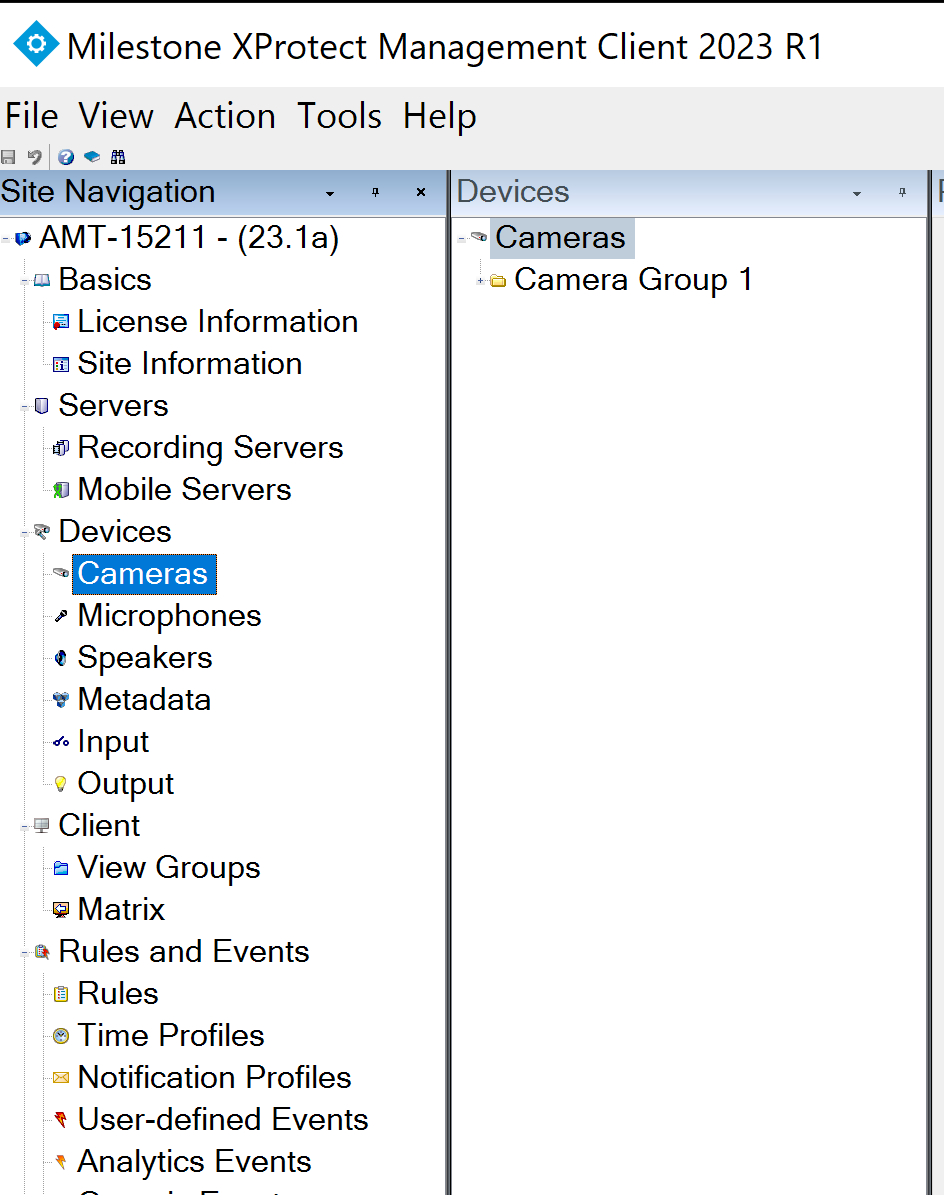
Figure 106 - Selecting the camera to import the cameras presets…
At this point you may need to widen the green highlighted box.
Next select the first of the cameras in the Camera Group 1 List.
Select Presets at the bottom of the next window highlighted by the light blue box.

Figure 107 - Selecting the camera to import the cameras presets continued…
Next select the Get button, this will then import the preset positions from the camera into the Milestone software / server.
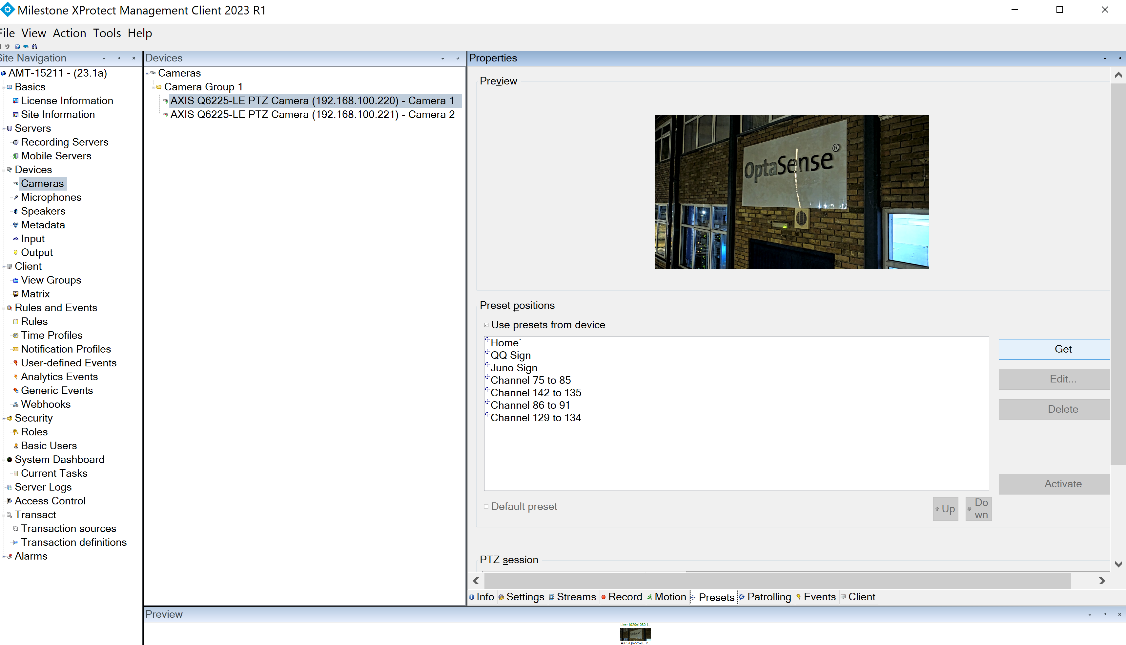
Figure 108 - Get the presets from the Camera
The next step is to add Generic Events.
Go to Generic Events in the orange box, then right click on Generic Events at the top of the green box.
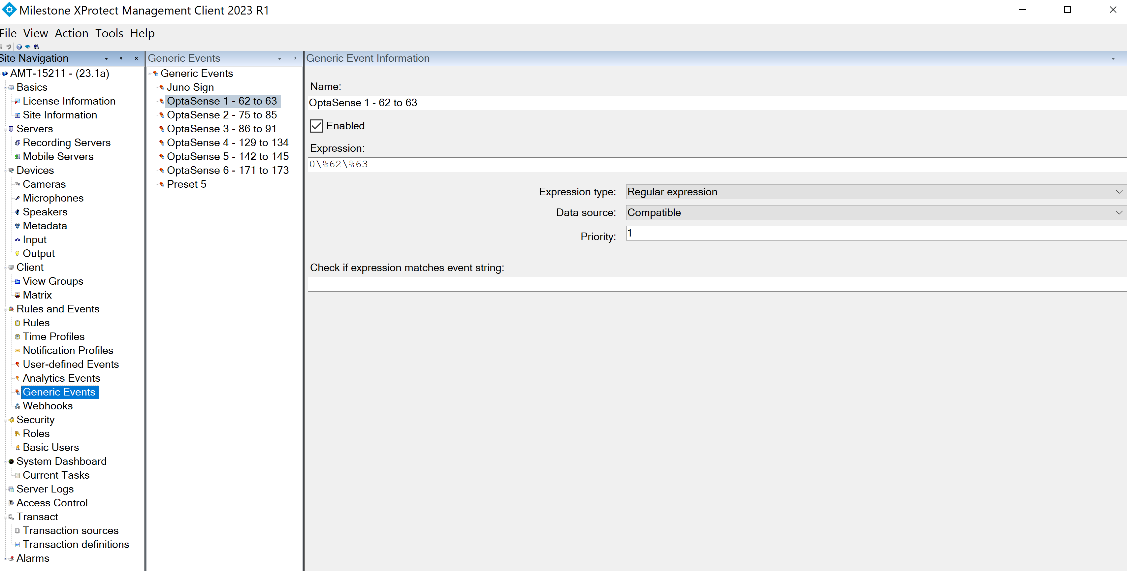
Figure 109 - Generic Events selection
Next select Add New �… or use the shortcut Ctrl + N.
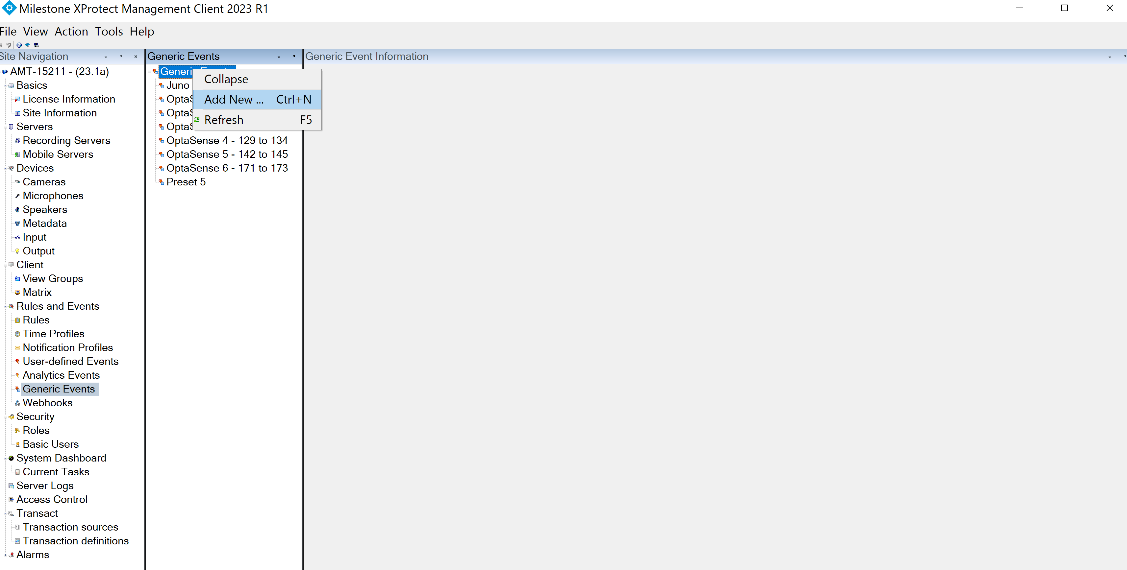
Figure 110 - Add new Generic Event
Next add a unique name for this Generic Event for example OptaSense Generic Event 1, then select OK.
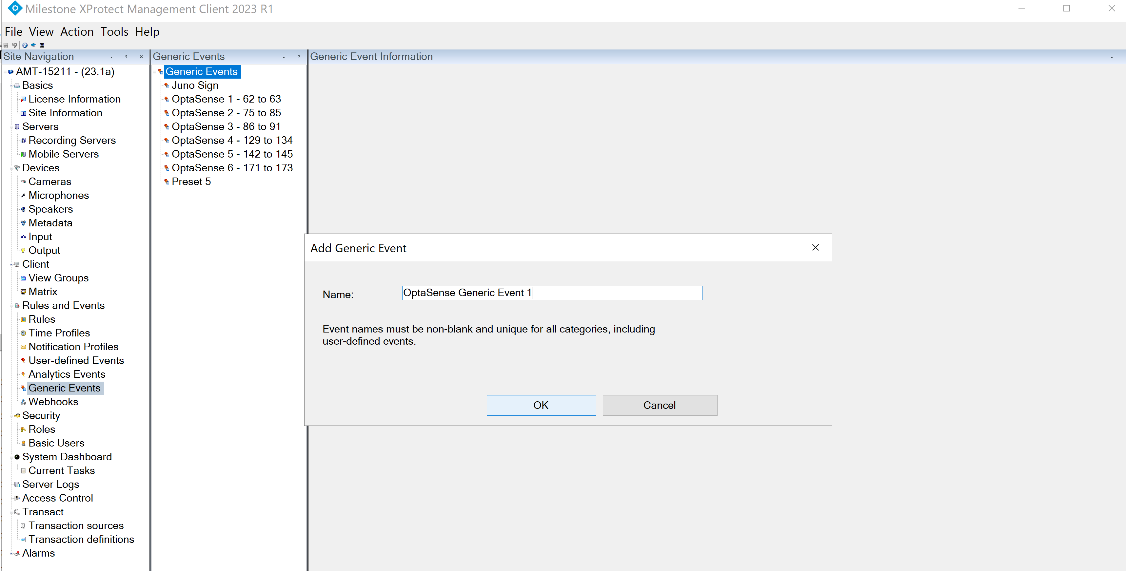
Figure 111 - Next add a unique name for this Generic Event
Next select Regular expression from the Expression type selection list.
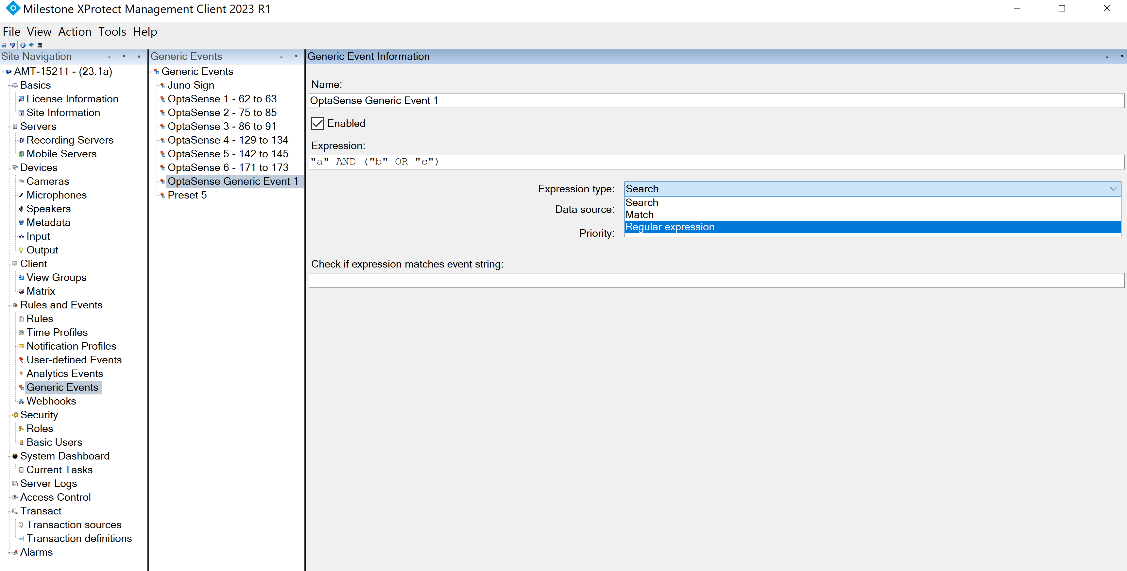
Figure 112 - Setting the Expression type to Regular expression
Check the following settings:
- Expression type is set to: Regular expression.
- Data source is set to Compatible.
- Priority is set to 1.
Next add the Expression as per this format:
0\%100\%200
OPS\%StartChannel\%EndChannel
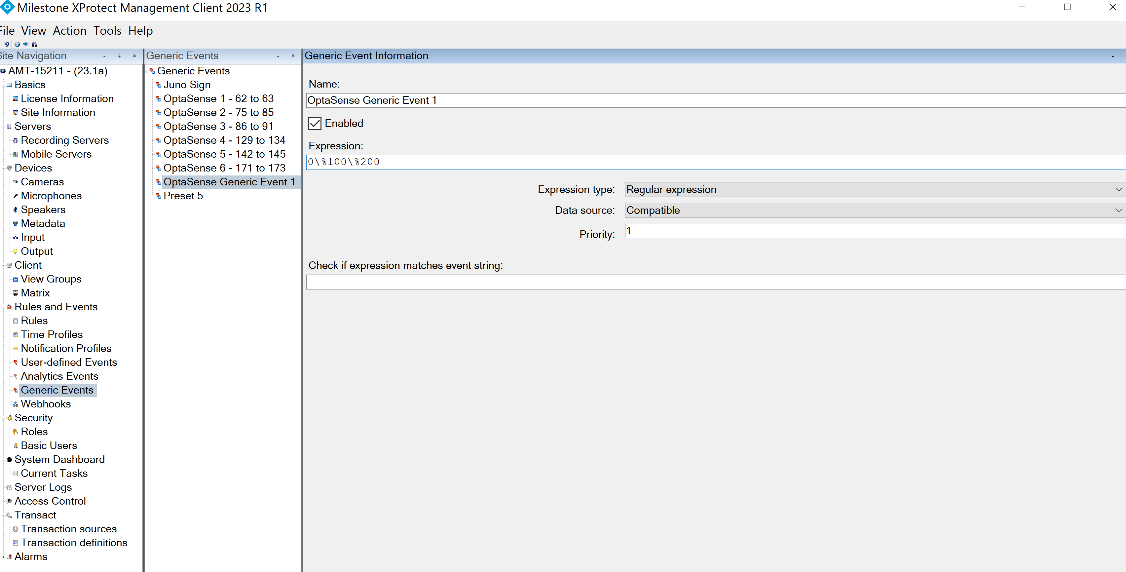
Figure 113 – Add the OPS, Start and End Channel for the related camera preset.
Finally select Rules from the orange section then move into the green section, this time right click on the Rules option near the top of the green section.
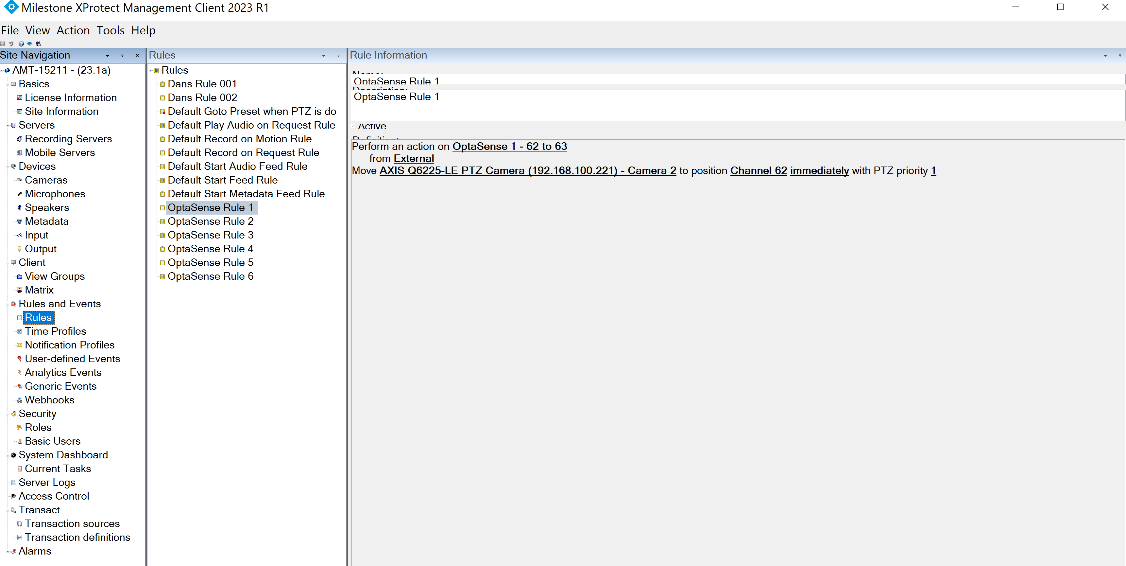
Figure 114 - Adding Rules
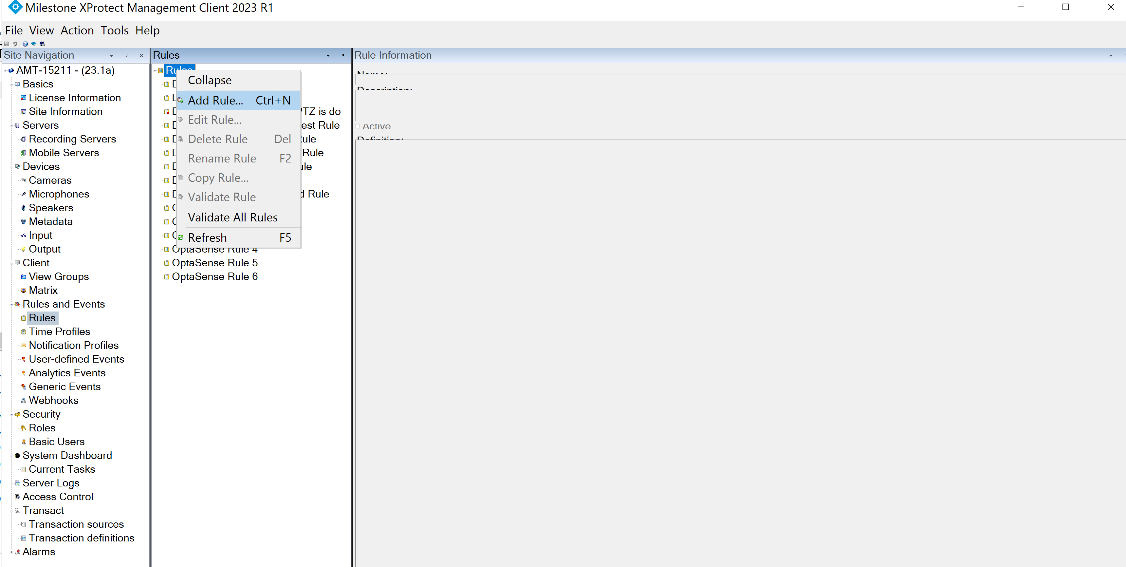
Figure 115 – Add Rule menu
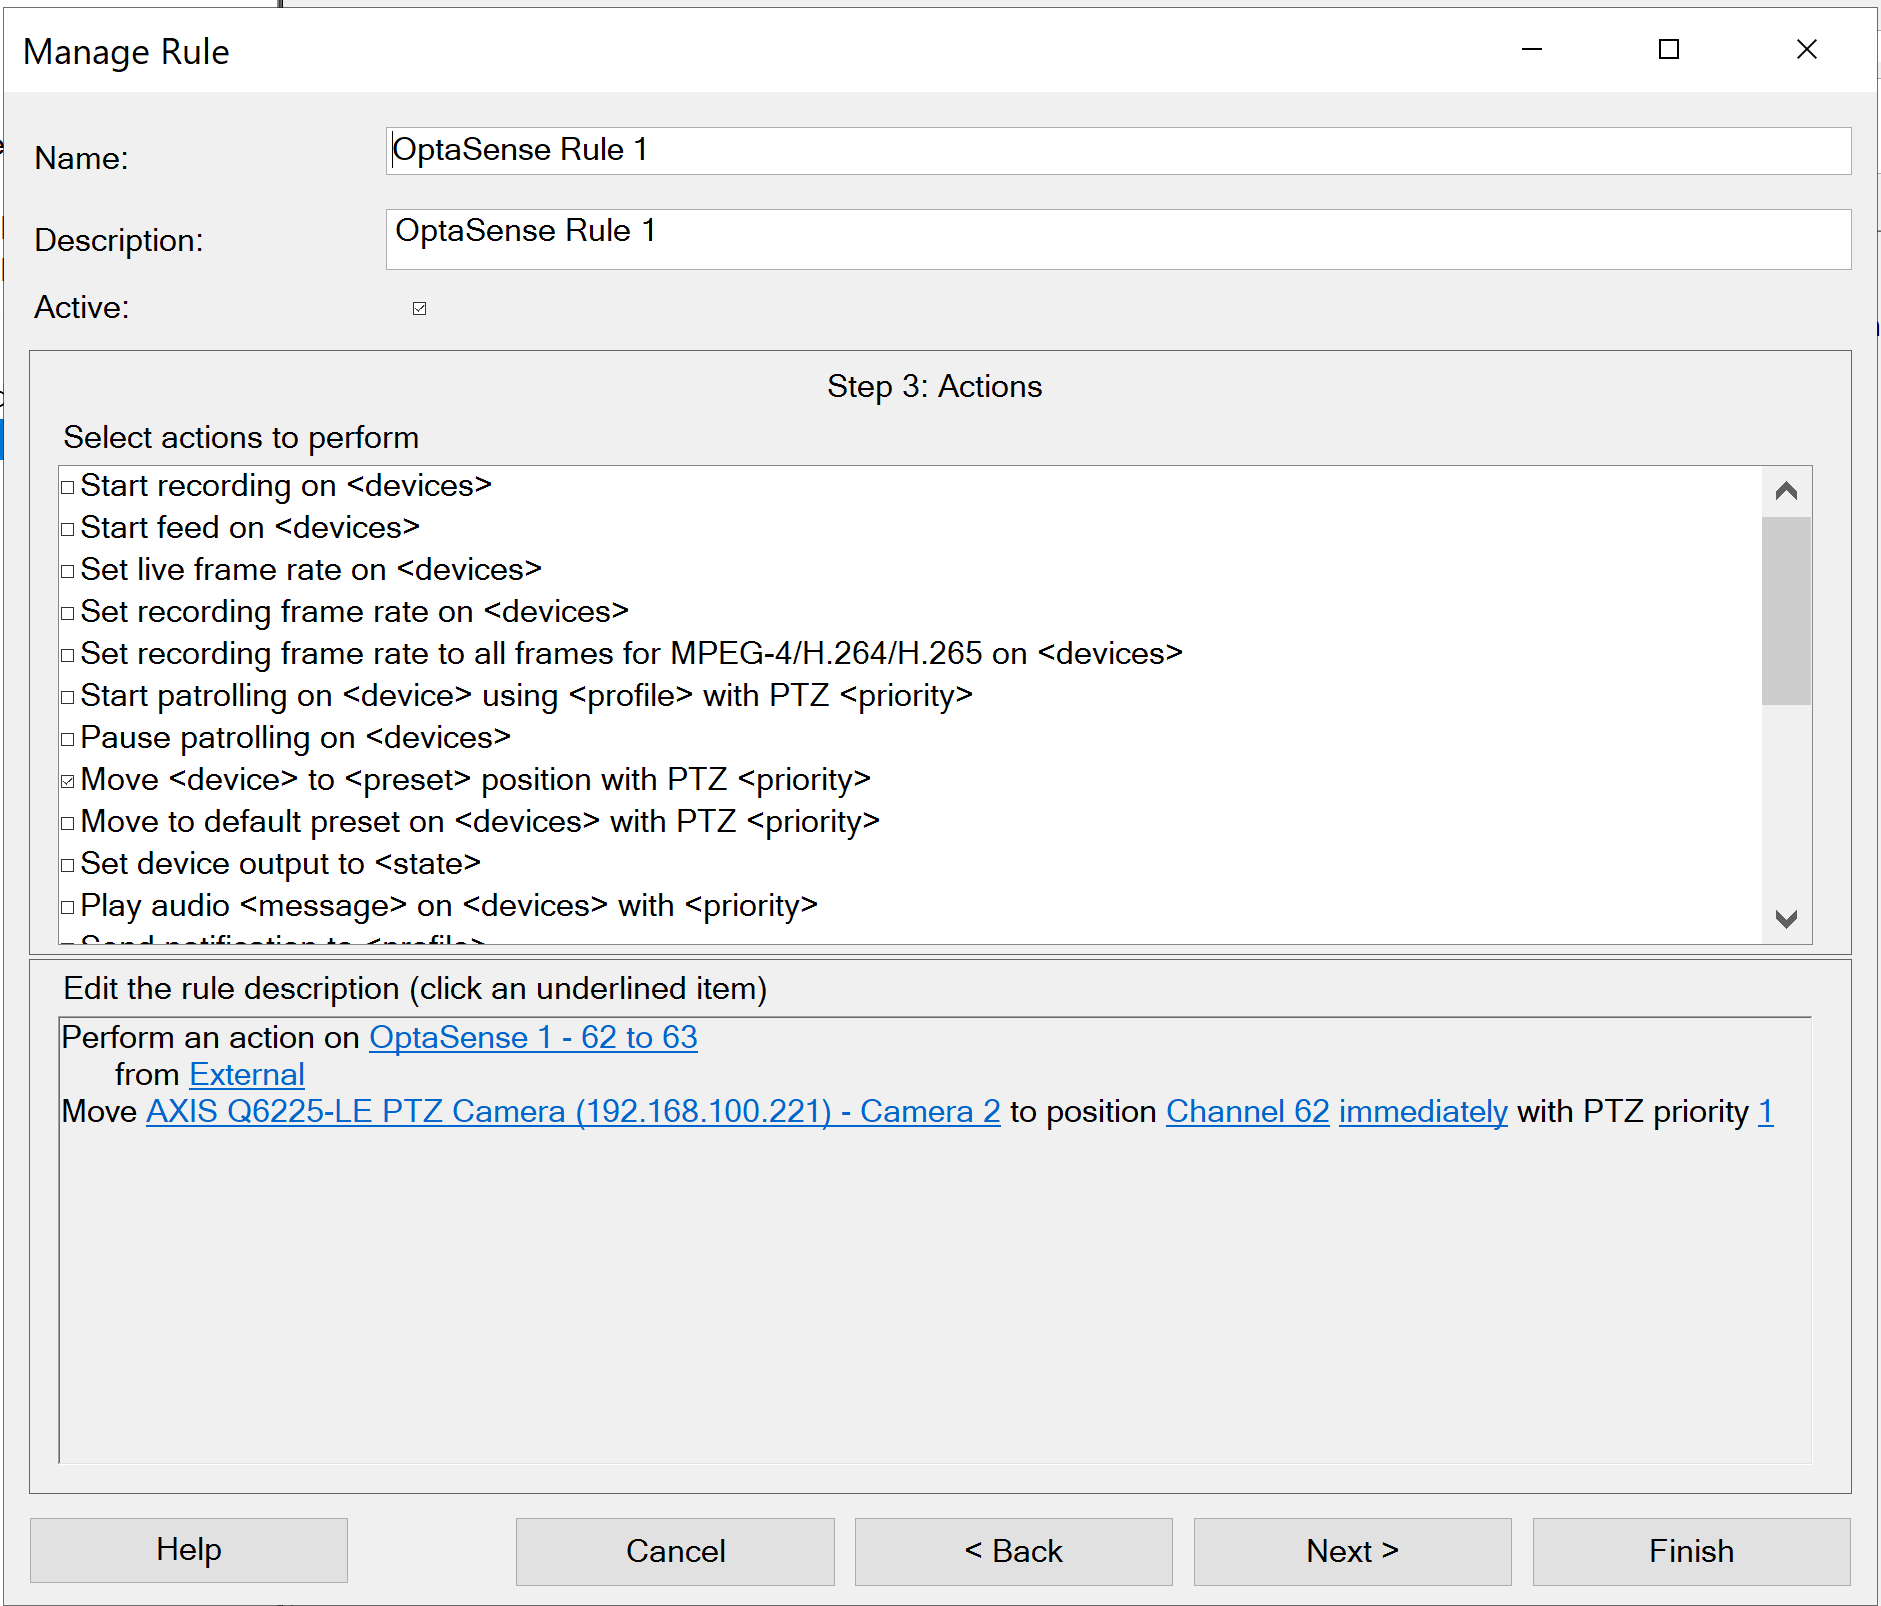
-
Add Unique Name.
-
Add Unique Description.
-
Check that Move <device> to <preset> position with PTZ <priority>
-
Select Event from External Event List, then press the OK button:
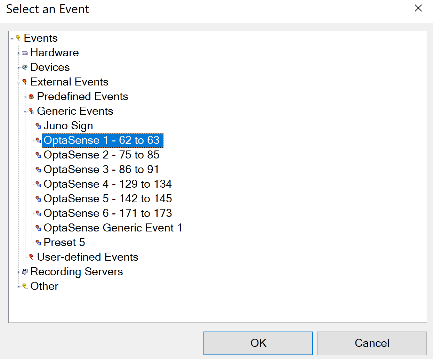
Figure 116 – Example External Event List.
The from External option must always be External.
-
Selects the source camera.
-
To position (refers to the camera preset selection).
-
Press Next to continue.
Check that No actions performed on rule end is selected, then select Finish.
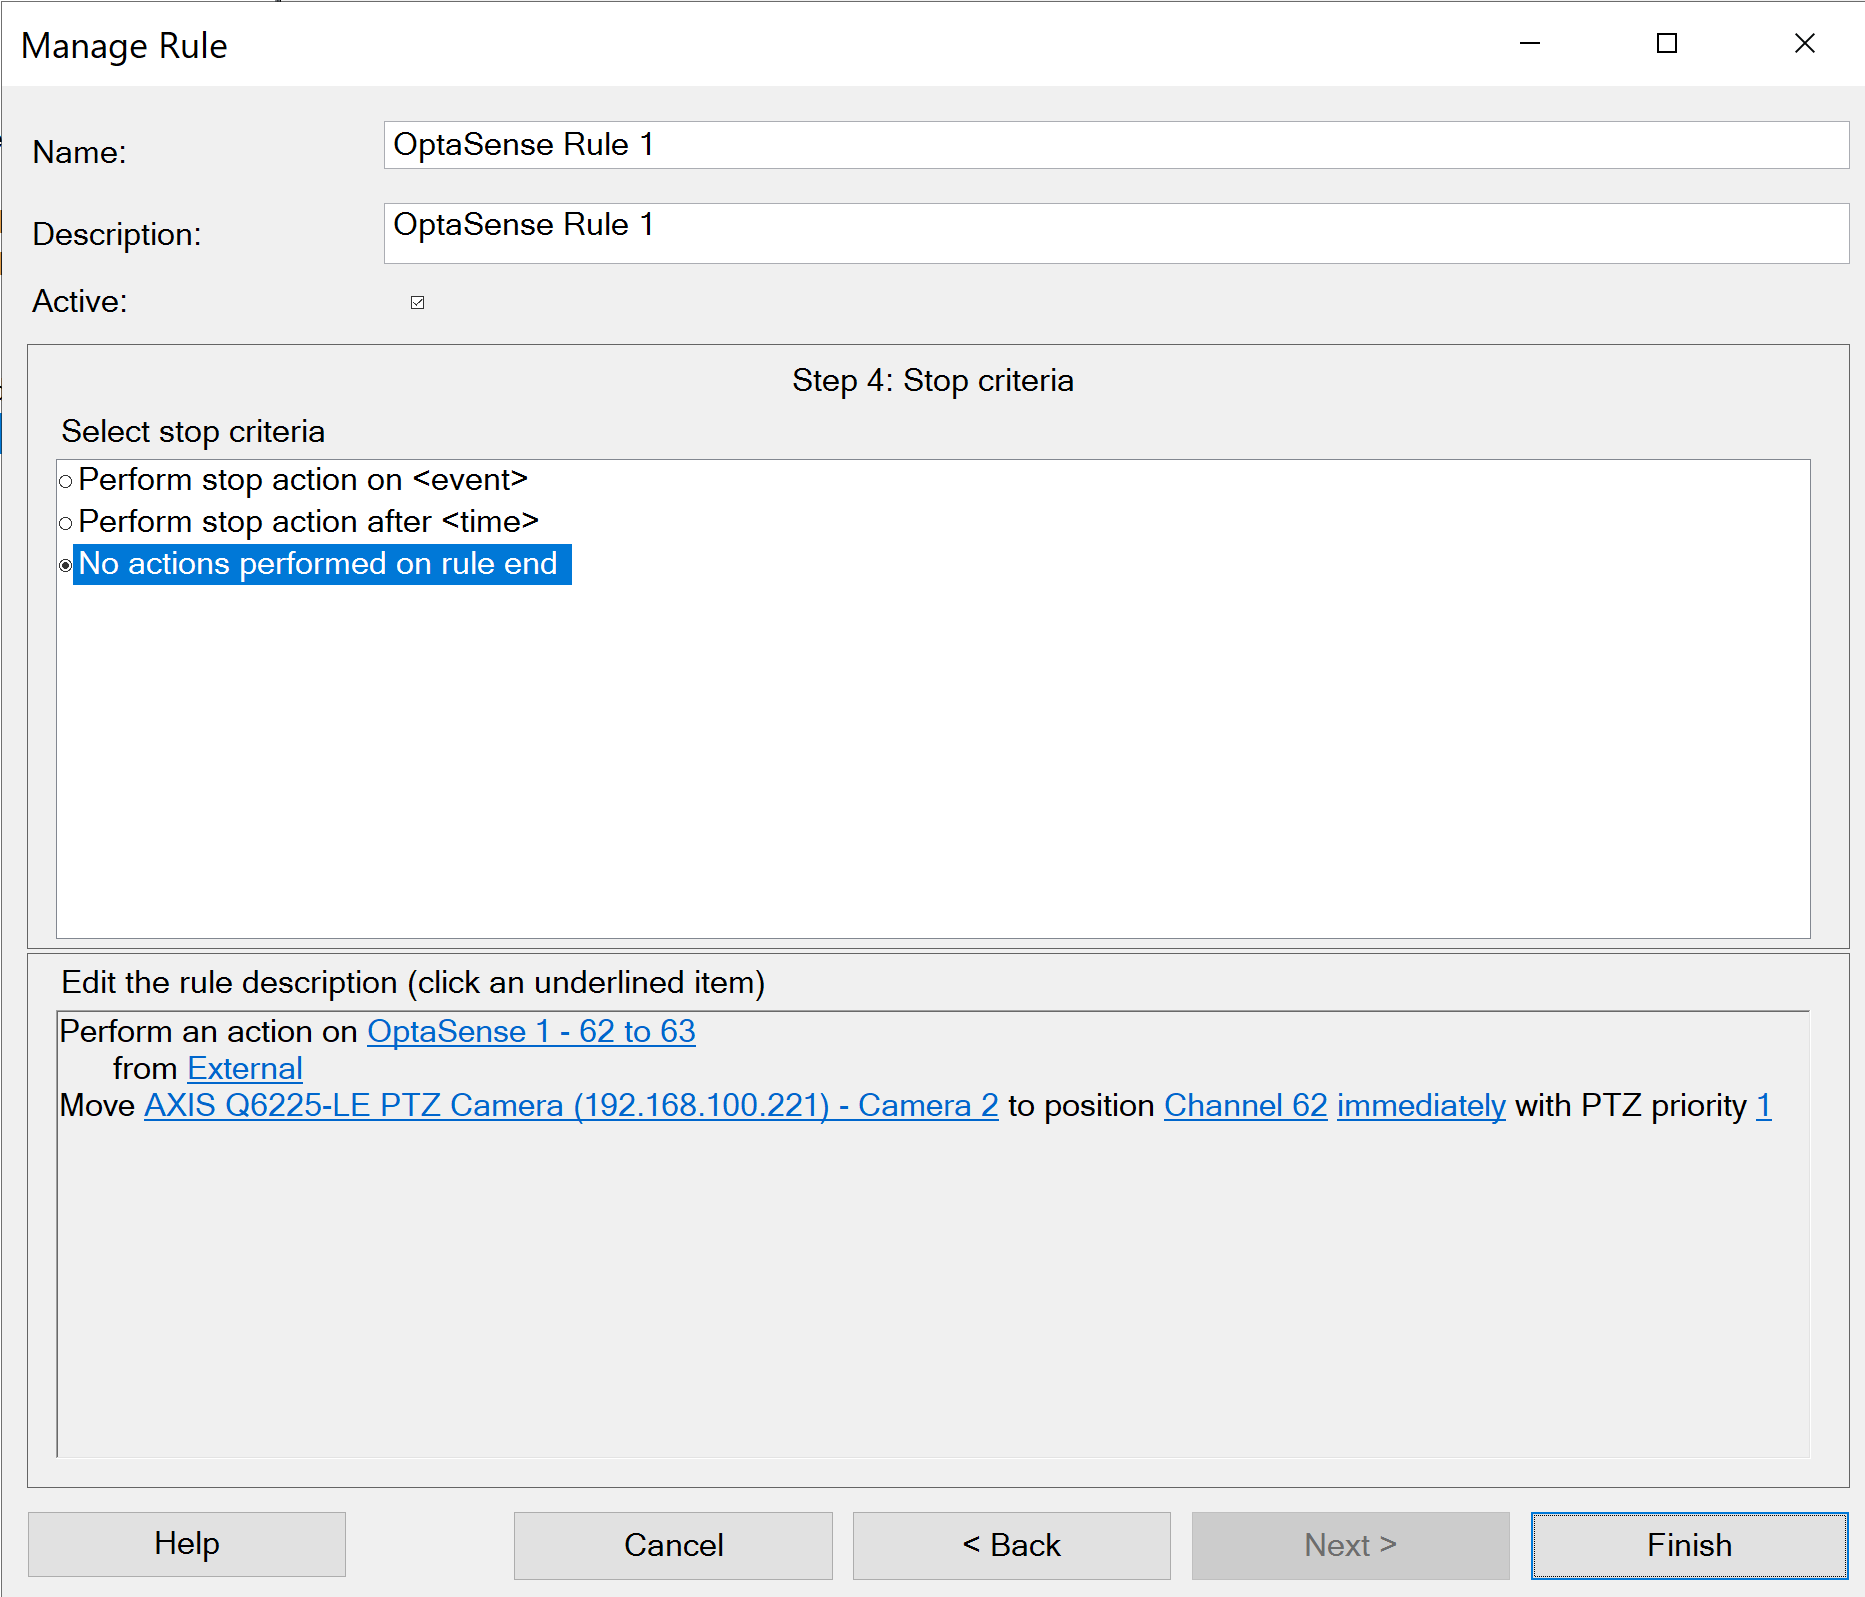
Figure 117 - Finish adding the rule
Moxa Dry Contact
There are several steps to configure a dry contact relay switch, these are:
- Correct assembly of the dry contact relay switch.
- Configuring the dry contact relay switch.
- Configuring the OptaSense software.
Currently, the dry contact relay switch used is a MOXA ioLogik E2214 Active Ethernet I/O 6 Digital Input, 6 Relay Output relay switch.
Safety
Ensure equipment is powered down and plug removed before connecting power MOXA ioLogik E2214. Although low power (12-36V DC) possible fault situations could cause the power supply to fail and provide a higher than normal voltage to the unit. Care should be taken when handling the power supply for both units. Check the voltage supplied from the power supply with a multimeter (if available); also ensure that the correct polarity for the power cable is connected. Positive is normally denoted by a white line along the cable. Polarity should be confirmed using a multimeter.
Function
The MOXA ioLogik E2214 is an RTU controller with 6 digital inputs and 6 relay outputs. Within the OptaSense system the MOXA ioLogik E2214 controller provides 6 relay outputs, which can be configured by the user as required. A relay or dry contact refers to a secondary set of contacts within a circuit that opens or closes controlling some other contacts or devices (siren, buzzer, lights etc). These additional devices will be normally supplied by the client and an understanding of the required alert and level are needed. Dry contacts are not designed to run additional devices directly and normally provide zero voltage. Wet Contacts are normally limited to 30V DC max voltage across the contacts.
The relay/dry contacts are typically in two states; Normally Open or Normally Closed. Normally Open signifies that the circuit and relay is in an open state during normal operation. For example, when running a siren which is only required to be powered at the instance of an alert or for certain alert type.
In a Normally Closed situation the circuit would be completed at all times and be broken when the relay is activated at the time of an alert. Multiple units can be linked together with each dry contact triggering an alarm for a given “zone” of coverage. This can be done by location on a perimeter and by KP / mile marker on a railway/pipeline, it should be noted that this reduces the resolution of the system.
On power up the default status of the dry contacts is off although this can be defined within the ioLogik E2214 Controller configuration and changed to ON or PULSE, also it can be configured to an interval which provides the ability to switch on the channel sequentially to avoid a sudden high-power burst.
On a power loss situation, the dry contacts open, if the system is designed to alert on an open contact this would cause an alert to be transferred to the client system ensuring that the power loss to the unit can be identified. Therefore, it is preferred that the default state of the dry contact set in the proprietary software is OFF.
Within the software the ioLogik device can provide three different output modes: HIGH, LOW and PULSE. HIGH and LOW change the dry contact to ON (HIGH) and OFF (LOW) conditions. Whereas a PULSE mode will change from a HIGH to LOW (or LOW to HIGH) for a user defined time interval.
If a dry contact is changed from one state to another, for example HIGH to LOW, when an alert is raised this will stay in this condition until the alert is acknowledged by the user.
If the mode is set to PULSE, the relay will change states for the specified time period and revert back to its default state. Therefore, if no user interaction is required with the software, then a PULSE mode must be used. The OptaSense Map Display tote will display a maximum of 1000 alerts (most recent).
Equipment
To enable the set up and configuration of the MOXA ioLogik E2214 the following is required –
- 12-48VDC power supply
- Ethernet Cable
- Multimeter / Buzzer for testing
- Optasense Software
Hardware Assembly
The hardware assembly is illustrated in Figure 115. It should be noted that the dry contact can be used for a wide range of applications in addition to a light or siren illustrated in the same Figure. It can for example be used to interface to the SCADA system.
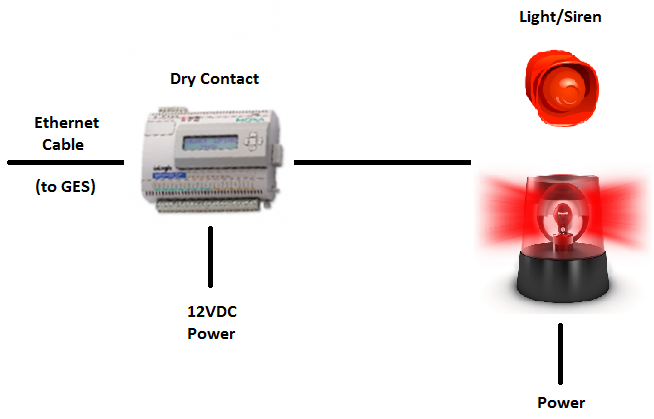
Figure 118: Dry Contact hardware assembly
It is important to get the power leads correctly as shown in Figure 116. Once the 12 to 36 VDC power line is connected to the ioLogik’s terminal block the power LED will glow a solid red (circled in green). NOTE 0V needs to be connected to V- and if a rack ground is present and available this needs to be connected to FG.
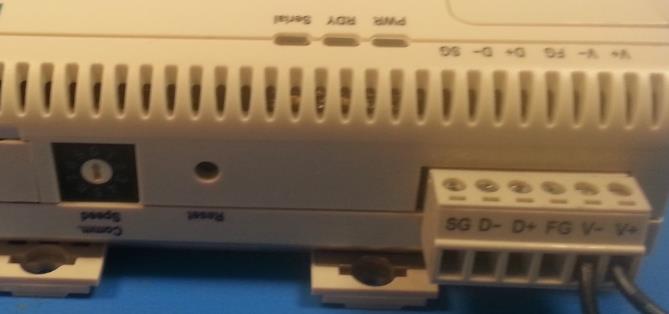
Figure 119: Dry Contact power leads
There are 6 relay switches (R0 – R5) Figure 117 that can be connected to external devices. Each of these relays have two output terminals that need to be connected to the external device. How they are connected will be dependent on the device being used. NOTE: For the FAT no external devices are used, verification is achieved by the ON/OFF indicator changing due to alerts and errors.
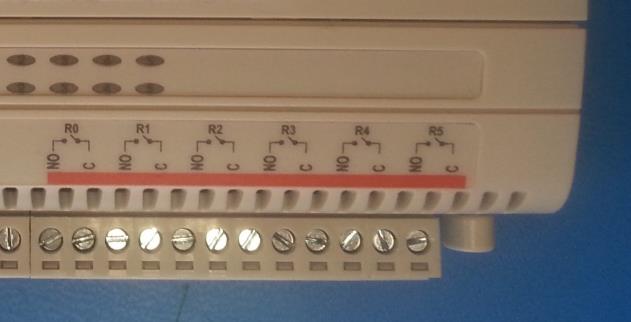
Figure 120: Relay Outputs
Configuring Dry Contact Switch
There are a few steps that need to be completed to configure the dry contact switch. They are to change the IP address to reflect the ND, configure the dry contact switch to alarm on loss of ethernet connection, configure the switch to use the NTP server as a time server and to set the output relay switches to be defaulted OFF (this needs to be coupled with the ioLogikConfig.txt file setup discussed at the end of this Technical Advisory Note).
Configuring IP Addresses
The first is to change the IP address the default IP address is 192.168.127.254. The steps for changing the IP address are as follows:
- Use a web browser to log on to the default IP address of 192.168.127.254.
- Select the ‘Network Settings’ folder within the left-hand pane.
- Select the sub-directory ‘Ethernet Configurations’ which brings up Figure 118.
- Enter the required IP address, subnet mask etc as per the approved system documentation.
- Press ‘Submit’.
- The 192.168.127.254 webpage will not be available now after the change. As a final check, enter a web browser the new IP address and check that it is set correctly.
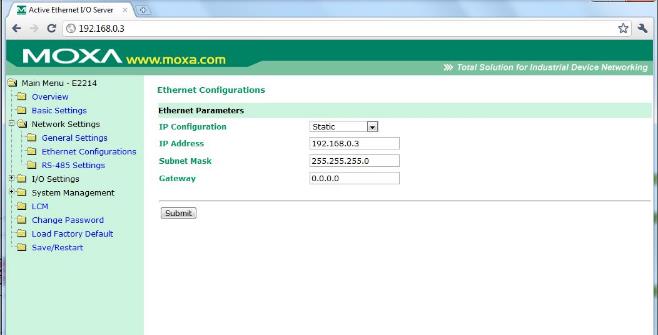
Figure 121: Dry Contact Ethernet configurations
Configure to Safe Mode on Loss of Eth Connection
- Use a web browser to log on to the new IP address as per the approved system documentation.
- Select the ‘Network Settings’ folder within the left-hand pane.
- Select the sub-directory ‘General Settings’ which brings up Figure 119 below.
- The “Enable communication watchdog” box needs to be ticked and the time set to 10 seconds or user specific time period. NOTE: There is no requirement to change the other settings (Server Name/Location or DNS Server)
- Finally click on “Submit” confirmation to save changes will appear select ‘yes’ and the changes will be saved.
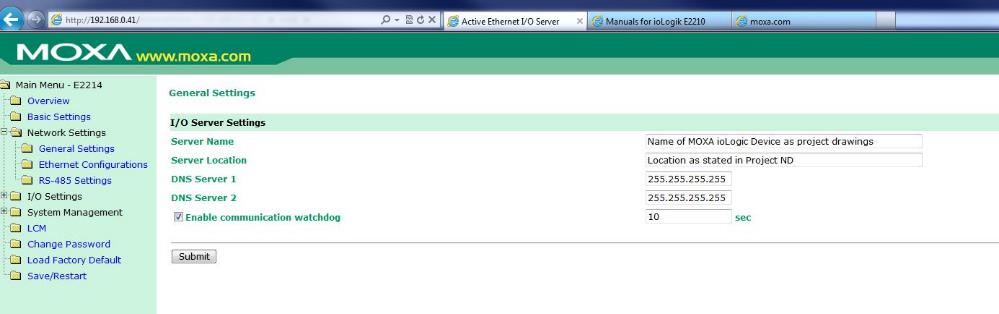
Figure 122: Dry Contact General Ethernet configurations
- On network outage this will put the dry contacts into the safe status mode as specified in section 6.7. Once the unit has lost network connection and has entered safe status mode it will continue in safe status mode until rebooted even with the network connection re-established. Whilst in safe status mode if the network is lost again the unit will stay in its current mode and not revert back to safe status.
- This safe mode on the dry contact ensure that they are reset to a “safe mode” i.e., off to reset the alarm and to stop causing nuisance alarms. An alternative method to monitor the communications with the ioLogik unit is to use the System Monitor and add the IP address of the unit and use the OptaSense software to monitor the network communications.
Configure Dry Contact Switch to use NTP Server
- Select the ‘Basic Settings’ folder within the left-hand pane.
- This will bring up the Basic Settings view Figure 120 below Enter the IP address of the NTP server into the “Time Server” field and ensure “Web console” is enabled. If the customer is not using an NTP server, enter the IP address of the PU being used for system time.
- Click on “Submit” this will then ask to save changes select yes and the changes will be saved.
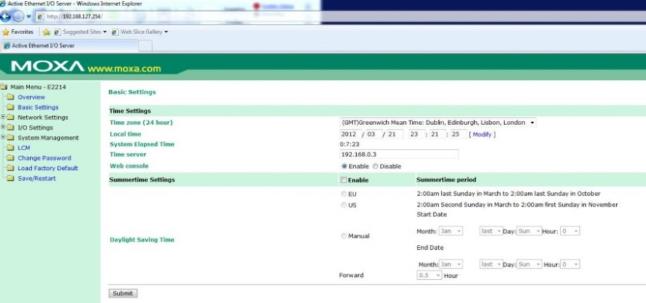
Figure 123: Setting up dry contact relay switch timeserver
Configure the Output Relay Switches to be Defaulted Off
- Select the ‘I/O Settings’ folder within the left-hand pane.
- Then select the sub-directory ‘DO Channels’ folder within the left-hand pane.
- Select each DO Channel in turn (DO-0 to DO-5) this will bring up the option window as detailed in Figure 121 below and select the “Power On Setting” to OFF and “Safe Status Setting” to OFF. This ensure that the software forces the dry contact to open and when power is lost the contacts open. With a Safe Status of off this will raise an alert to the user if network connection is lost.
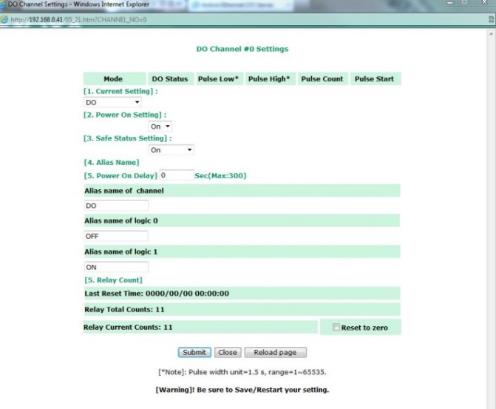
Figure 124: Configure the output relay switches to be defaulted ON
- Depending on the user requirements it may be preferred to either set all relays to the same safe status i.e., all off or opposite to the default or designate a signal dry contact to indicate a network issue and all other dry contacts revert to the default position so that spurious alarms are not raised.
- Once all outputs DO-0 to DO-5 have been set to on the dry contact relay switch configuration needs to be saved and rebooted to do this the “Save/Restart” folder needs to be selected this will bring up the Save/Restart window as detailed in Figure 122 below. Within this window select “Submit”.
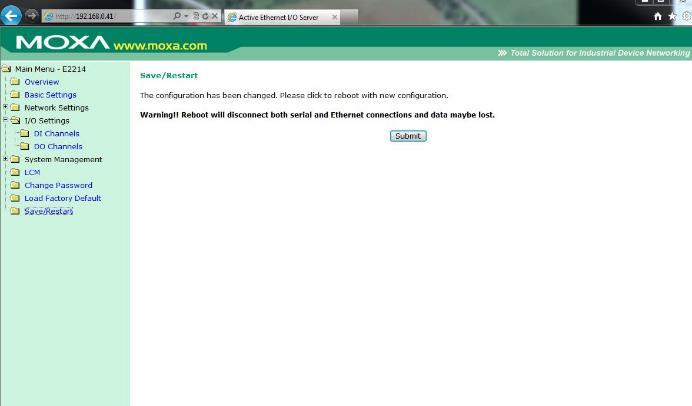
Figure 125: Save / Restart window
- The dry contact relay switch will now restart, and all DO outputs will now be OFF. This can be confirmed via the status lights as seen in Figure 123 below.
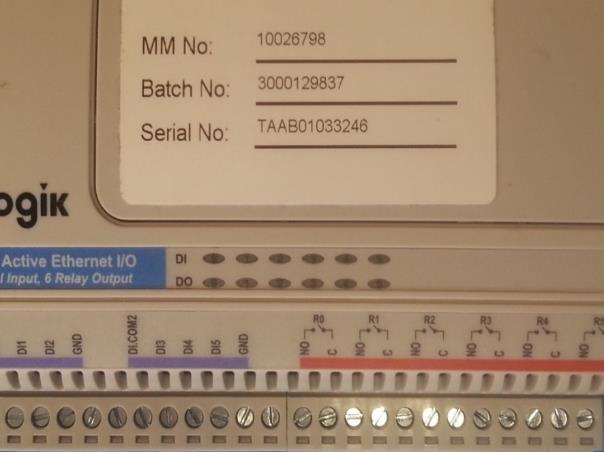
Figure 126: DO Output Status LEDs
Export / Import System Config
It is possible to export the ioLogik System Configuration to save the existing configuration and also to enable the configuration to be imported into a replacement or secondary unit if required.
-
To Export the configuration file under the System Management menu in the left-hand pane select Export System Config
-
Click the hyperlink displayed to export the system configuration file and save to an appropriate location
-
Upload the exported System Configuration file to the Project Workspace on Huddle
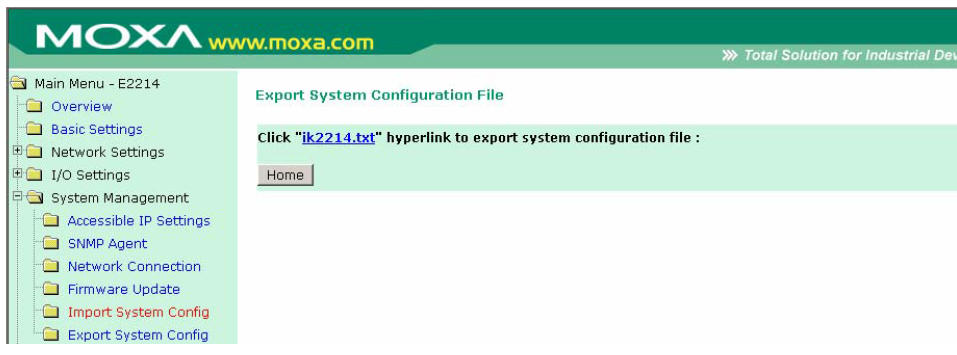
Figure 127: Export System Configuration
-
To Import the system Configuration, select Import System Config from the System Management Menu
-
Browse to the location of the ioLogik configuration file (i.e. “ik2214.txt”)
-
Click Import to import the file to the unit (Note: The file import process may take around 10 seconds. Do not disconnect power or network cable unit the file import has been completed)
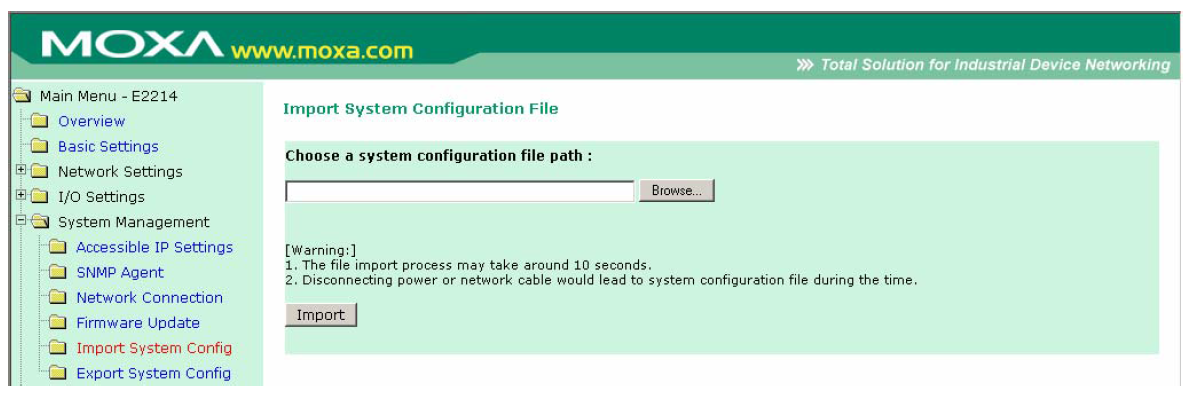
Figure 128: Import System Configuration
Adding Dry Contact Process into the System
Please refer to Module 12 on how to install a process into the system via the system descriptor
Dry Contact Wizard
If the Dry Contact (or ioLogik) controller is required for the system and has been included in system descriptor, the option to configure the Dry Contact via the OptaSense Configuration Wizard. Initially the Dry Contact will not be configured for use; the user will need to create a set by selecting the “Create Set” button Figure 126.
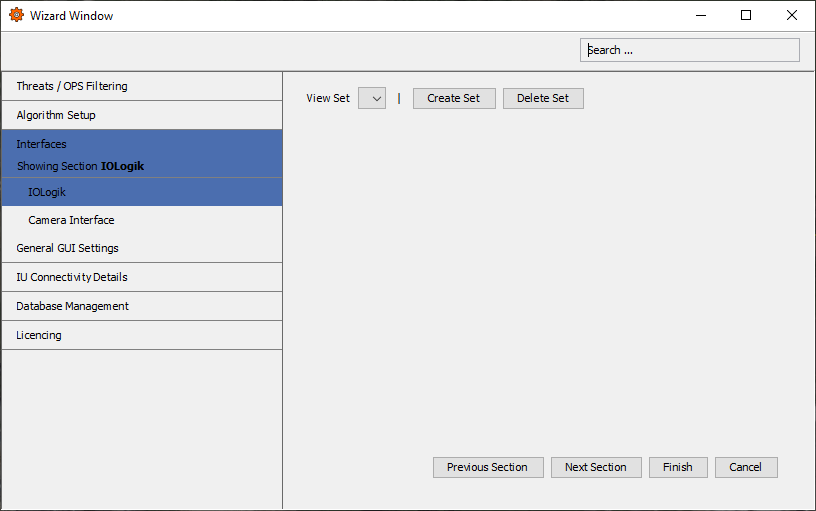
Figure 129: Dry Contact Configuration
Once a set has been created, the user is able to add the Host IP address from the ND and the number of ioLogik outputs (default 6), if additional Dry Contact (ioLogik) units are to be installed additional sets can be created with the individual IP addresses for the units.
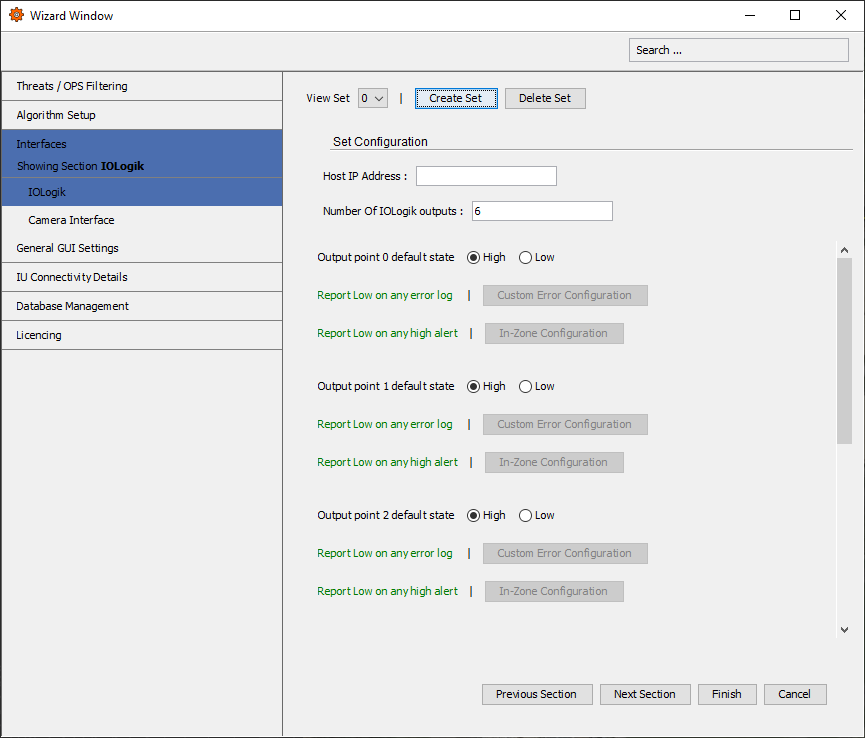
Figure 130: Dry Contact Set Creation
The user can then configure each individual Output on the Dry Contact unit. This includes the default state, either high (closed) or low (open), and also to report a high (closed) or low (open) on any system error or high alert (option changes depending on the default state). If report high/low on any high alert is deselected and the “In-Zone Configuration” is required, an additional window will open allowing the user to add the In Zone Configuration for the specific ioLogik Output Figure 128. To bring up this window, right click in the In-Zone Configuration window to add an In-Zone configuration.
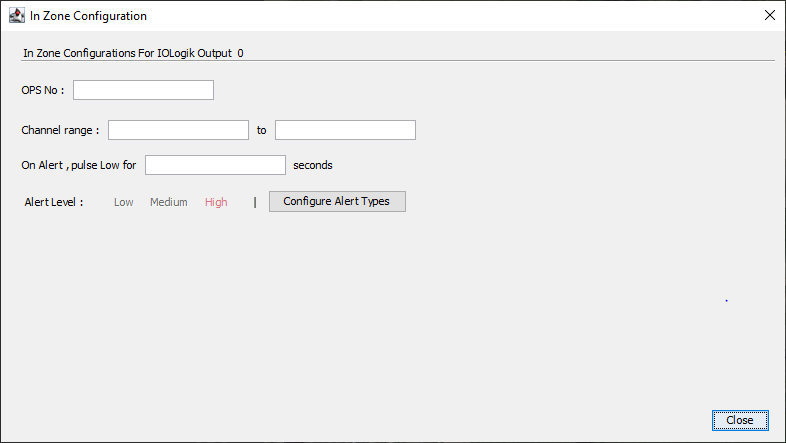
Figure 131: In Zone Configuration Window
The user is then able to enter the specific OPS number and also the Channel range for the output to the identified with. This enables the dry contact output to be classified with a specific zone on a specific OPS which allows additional user configuration on how the dry contact operates on the system. Once the required OPS and channel range has been entered it is possible to enter how long the output pulses (to Low) for in seconds and also which alert level (Low, Medium or High). It is then possible to select the individual alert types for the dry contact to trigger; the unit can be configured to trigger on multiple alert types or single alert types.

Figure 132: Alert Type Details
Troubleshooting
If ioLogik is displayed as ‘Crashed’ in ‘System Health’ or doesn’t appear in the ‘System Health’ at all after you have added it in the ‘System Description Editor’ please ensure you have fully closed the OptaSense software and open it again. If ioLogik still isn’t working properly, please remove it from ‘System Description Editor’ and add it again. For any other Dry Contact software issues please investigate the ioLogik Logs. As MOXA is a 3rd party system for hardware issues, please refer to the MOXA external manual.
OPC-UA Setup
To integrate OPC-UA into OS6 software, it will need to be installed via the System Descriptor. For information on how to install a process, refer to section 2. Note: The older version of OPC-DA (Matrikon explorer) still features in earlier OS versions, however it is now being phased out by this interface and is NOT available to new clients. For information on how to install this older OPC variant please consult an earlier release of the OS Installation Manuals.
Figure 133: Setup Schematic
Launch the OS6 software. From the Configure menu, select Wizard then OPC-UA 1.
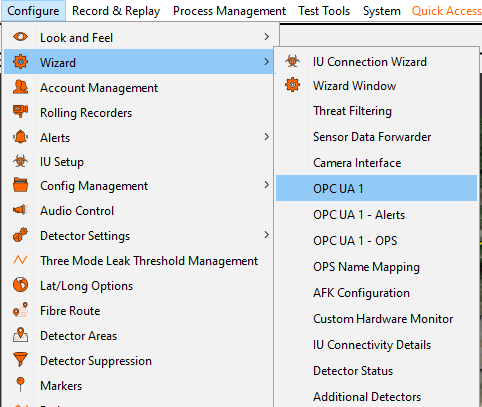
Figure 134: Accessing OPC UA
The OPC UA 1 section will require details relevant to the client (Client: Clients OPC-UA Software).
Connection Settings
- Port: Is the port number the server (PU) uses to pass /receive data. Typically, this can be left as default unless required.
- Bind to all Network Interface address: Can be checked when there is a single client within the network. Works like an auto client scan.
- Bind to specific Network Interface Address: Can be checked if the IP address of the client is known.
Note: If there is to be multiple OPC-UA Interfaces in a system (For example OPC-UA 1 and OPC-UA 2), using the Bind to specific Network Interface Address ensures each OPC-UA Interface can be linked to the correct client.
OPC-UA Configuration
- Username & Password: Is where a username/password can be specified and therefore required by the client. Typically, this can be left as default (Anonymous) if security isn’t a concern.
Alert Level Settings
- Send only High Alerts: Can be checked so that the system will only post high-level alerts.
- Send only New Alerts: Can be checked so that the system will only post new alerts and not updates of existing alerts.
Log Message Settings
- Lowest Level of log message to send: Can be selected to refine what type of log messages will be posted (Not alert).
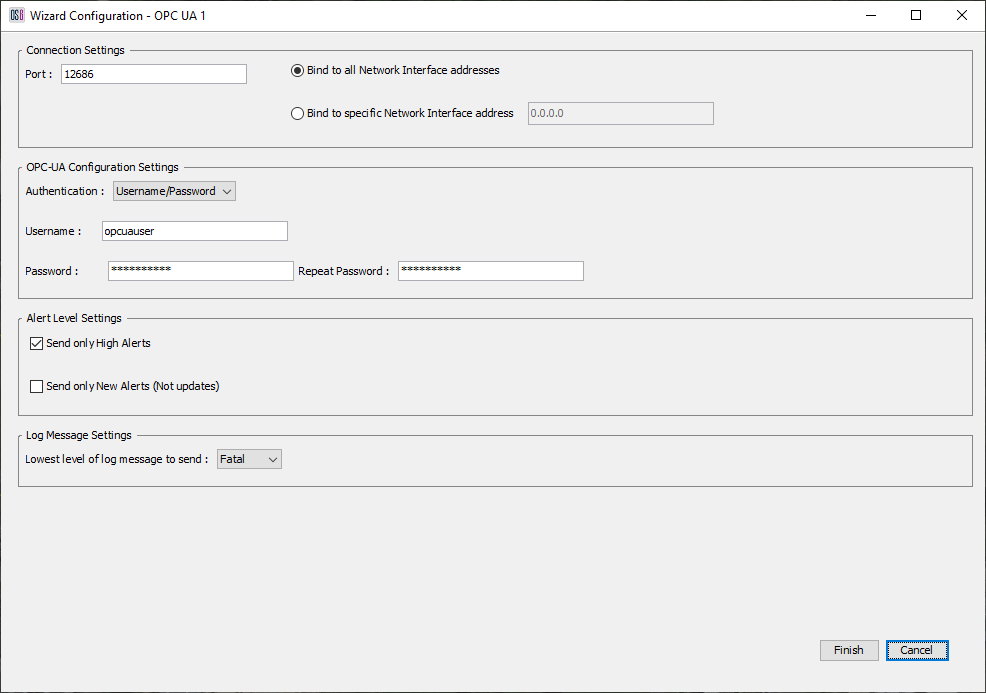
Figure 135: OPC UA 1 Configuration Section
The OPC UA 1 - OPS section can be used to specify which OPS / s will post data to the client. Highlight which OPS’s are required and select the right arrow to move them across to the right box.
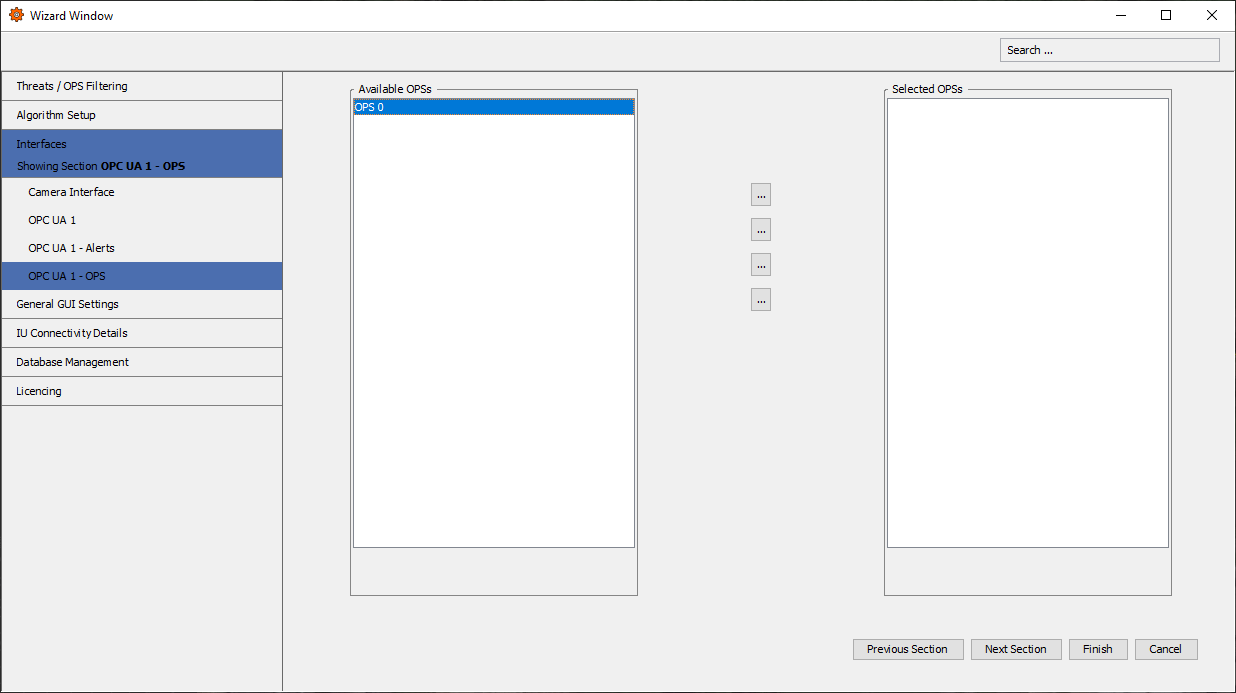
Figure 136: OPC UA 1 Configuration Section
The OPC UA 1 - Alerts section can be used to specify which Alerts will be posted to the client. Highlight which type of alerts are required and select the right arrow to move them across to the right box. Once all the required settings have been set, select finish to save the changes.
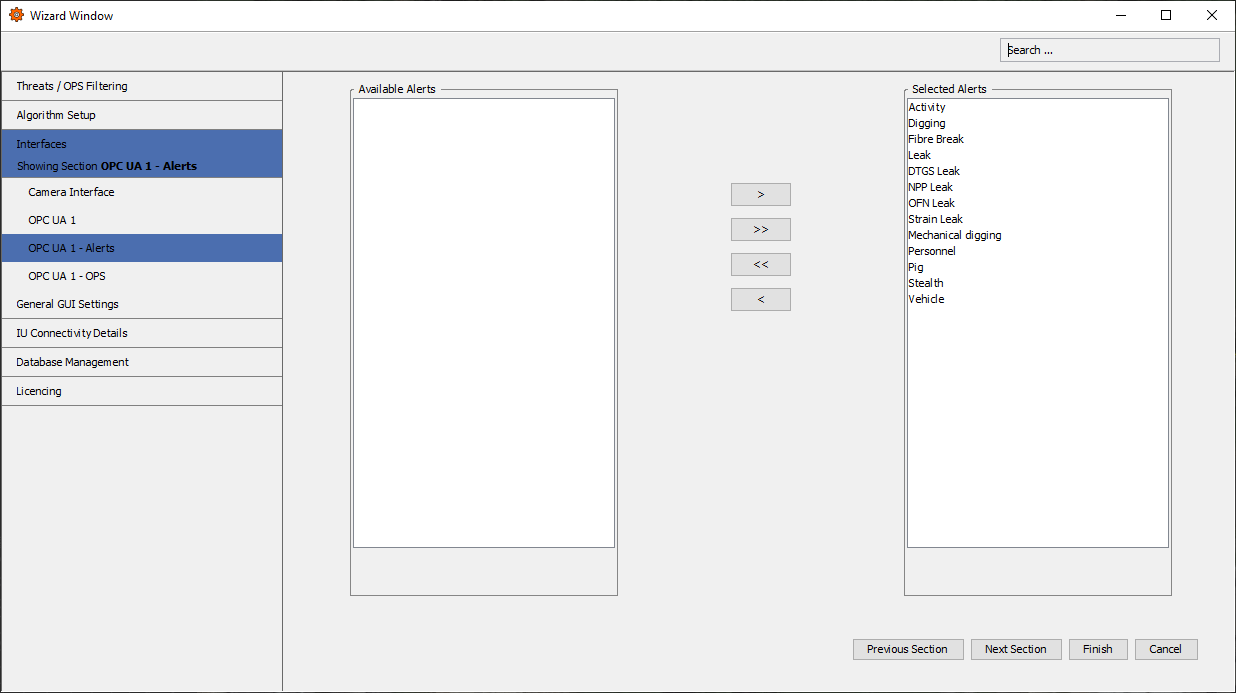
Figure 137: OPC UA 1 Alerts Section
Because there are various software’s that can operate as a client to the system, this guide will only give a basic overview of what may be required for the system to pass data to the client. Below are the typical connection settings for an OPC-UA client. The minimum information required should be,
-
Server Information / Endpoint: is a connection string. The required string will be:
opc.tcp://<SERVER_IP>:<PORT>/ola-opcua
-
SERVER_IP: is the IP Address of the PU.
-
PORT: Is the port number the client uses to receive data. Typically, this can be left as default (12686) unless required.
-
An example of a full string is OPC.tcp://192.168.100.1:12686/ola-opcua
-
Transfer Protocol: Should be set to OPC.tcp
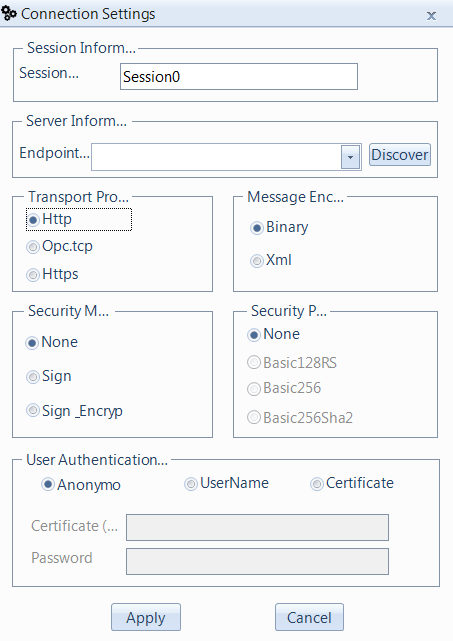
Figure 138: OPC-UA Client Connection Settings
Note: the CU, PU, IU and OPC-UA Client will typically need to be on the same network for everything to communicate.
Rest Interface
The Rest Interface can be used to interact and receive live and historical information from the OS6 system externally. The REST interface can be easily integrated into new or existing services to receive Histogram data or Alert information within a Local Network.
There are some basic configurations values that can be altered once the Rest Interface module has been installed. You can access this configuration from the REST Interface Configuration dialog.

Figure 139: Rest Interface Configuration Dialog
- Port: The TCP port that the REST Interface will listen on for interaction.
- Username: The username used to secure the REST interface.
- Password: The password used to secure the REST interface.
Modifications to the REST Interface configuration will apply to the entire system.
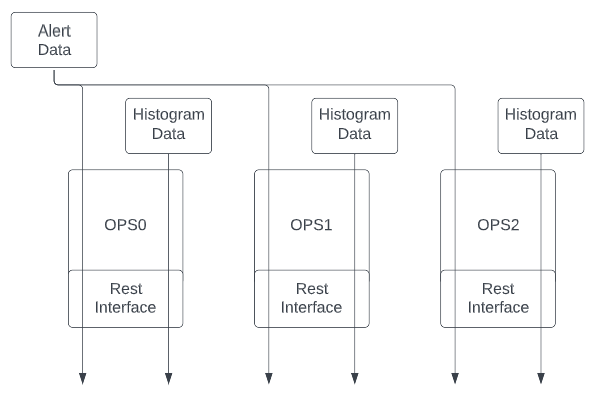
Figure 140: Hierarchy of Rest Interface
To access the REST Interface it is firstly important to understand the interface using the generated Open API documentation. The documentation can be accessed via any server running the REST Interface via any modern web browser.
http://<ip address>:<port>
Where the IP address is the address of the server and port is that which has been configured via the REST Interface Configuration dialog.
To access specific REST endpoint you can use a similar HTTP request as below.
http://<ip address>:<port>/api/<endpoint>
Where endpoint is the name of the REST endpoint as documented.
Note* Histogram Live or Historical Waterfall streamed data must be accessed directly via the OPS where the data resides.
HTTP Interface
The HTTP Interface has now been superseded by the REST Interface, please see section 10. In subsequent releases this interface may become deprecated and no longer be supported. Any customer wishing to interface with the OS6 system it is highly advised they implement an interface to our REST Interface.
To integrate the HTTP Interface into OS6 software, it will need to be available as a service via the System Descriptor Editor. For information on how to install an additional process, refer to Module 12
This chapter first verifies that alerts are being received on the system (and on the desired test CU) and then sets up the HTTP service to verify that alerts can also be received on that channel.
Running the Alert Injector
To allow Alerts to be created without an Interrogator Unit (Sensor), an Alert Injector has been provided. This will create Alerts for testing purposes into the OptaSense System.
Alert Injector should only be used for test purposes once set up this should be connected to an IU and tested with real data/alerts.
-
The Alert Injector can be accessed via the Test Tools menu. Please note, however, that this feature should be added to the OptaAdmin role and log in as Super User

Figure 141: Alert Injector icon in the Test Tools menu
- There are two modes, Performance mode and Inject Mode.
- Performance mode will inject random alerts. The alert types and levels can be selected from the options displayed. The total number of alerts to inject can also be entered. After all selections have been made, press inject to start displaying the alerts on the screen. Random OPSs will be used for this type of test along the whole installation. A range of time can also be selected to inject the alert randomly.
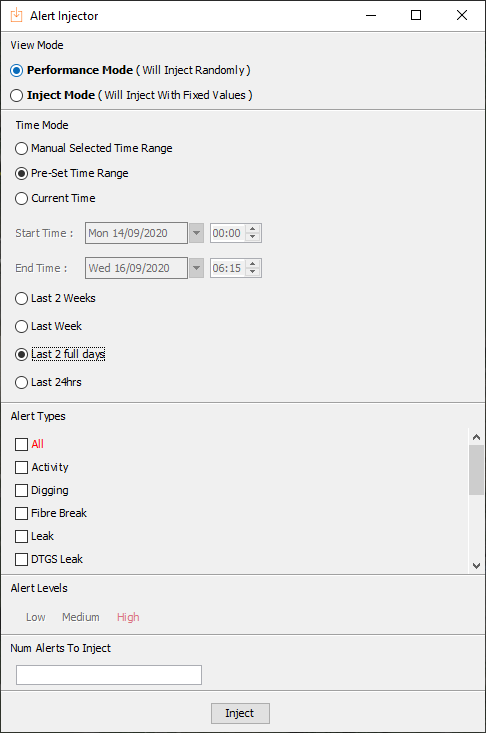
Figure 142: Performance Mode display
- Inject Mode will allow the user to select specific alerts with the desired alert level on a selected OPS and a specific channel. However, as with the performance mode, these can be set to random. It will then inject those alerts with the desired fixed values for testing purposes.
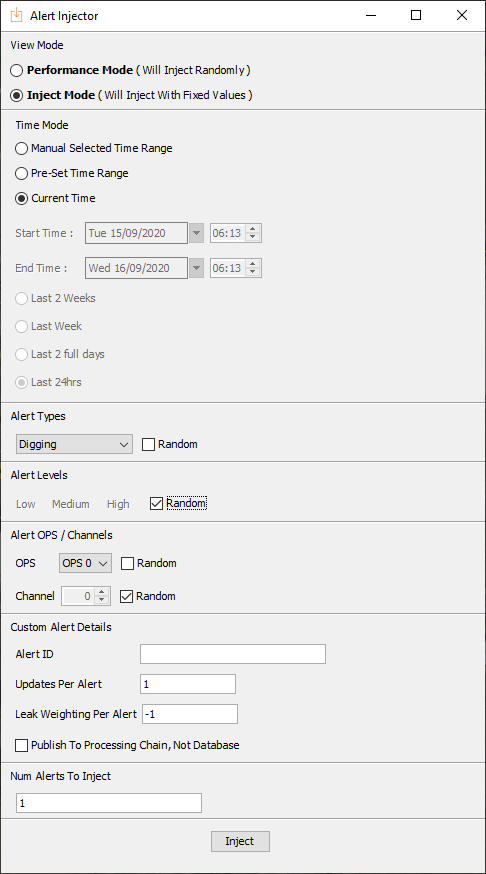
Figure 1434: Inject Mode
Confirming Alerts created in OptaSense
To view the High Alert List, select Alert List from the Live Analysis menu. For Medium and Low alerts, select the Pre Alert List.
 or
or 
Figure 1445: Alert List from the Live Analysis menu
The Alerts can be selected also from the map window on the right alert pane as shown below:
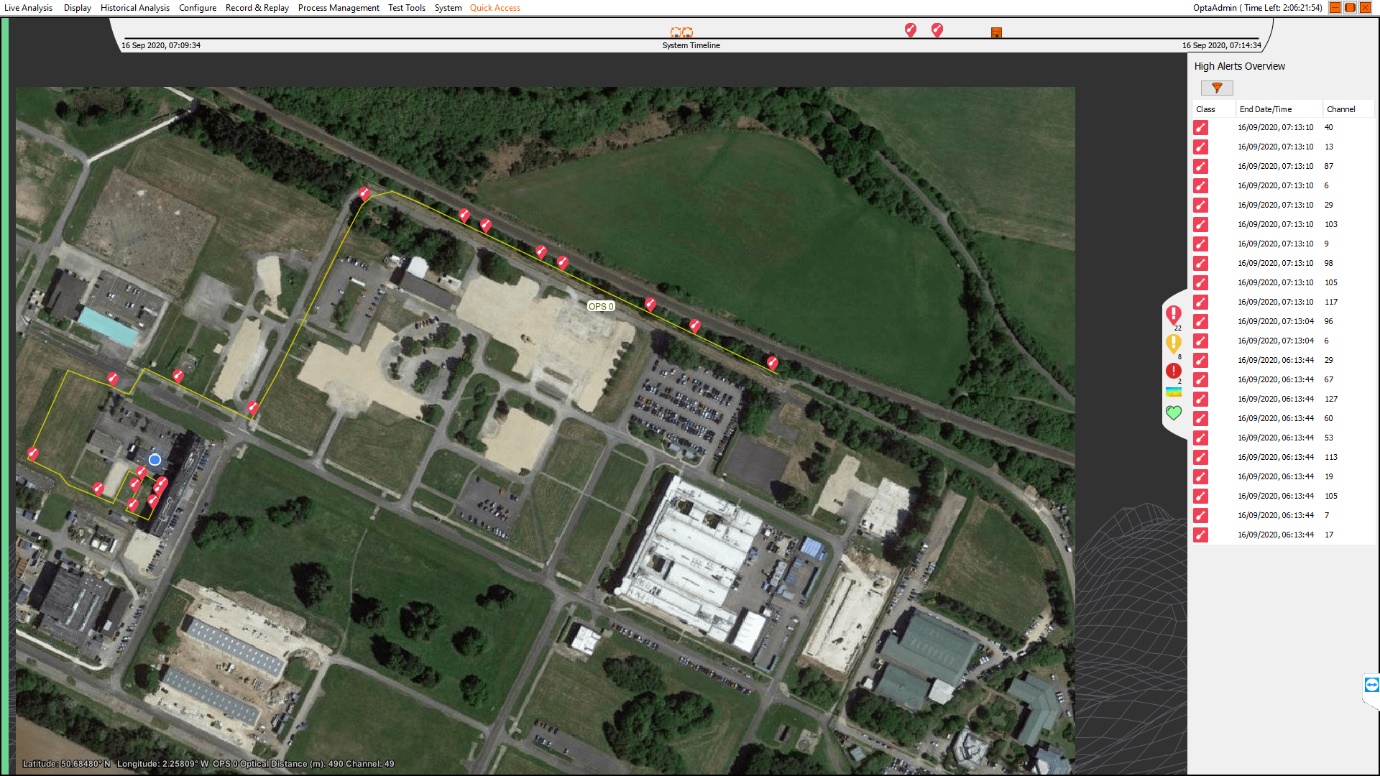
Figure 1456: OptaSense Map window, Alert pane
As the unique alerts are inserted into the database, they will appear on the alert status panel on the right-hand side of the map window, as shown in the image below:
For updated alerts the end time will automatically update as they are generated.
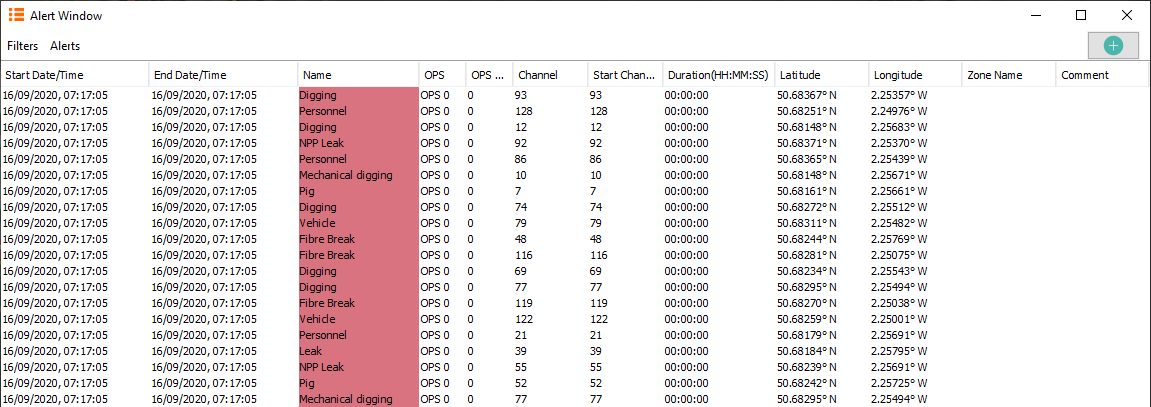
Figure 1467: Alert list window
Please note that only ‘High’ level alerts will be displayed in the Alert List.
Low & Medium Alerts will be displayed on the Pre Alert List.
Confirm HTTP Interface settings are correct.
From the Configure menu, select Wizard and open the wizard window and select the OLA Interfaces option. From there, select HTTP Interface 1.
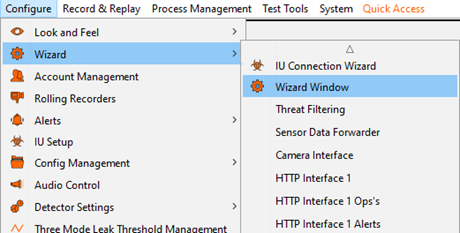
Figure 1478: Opening the Wizard Window
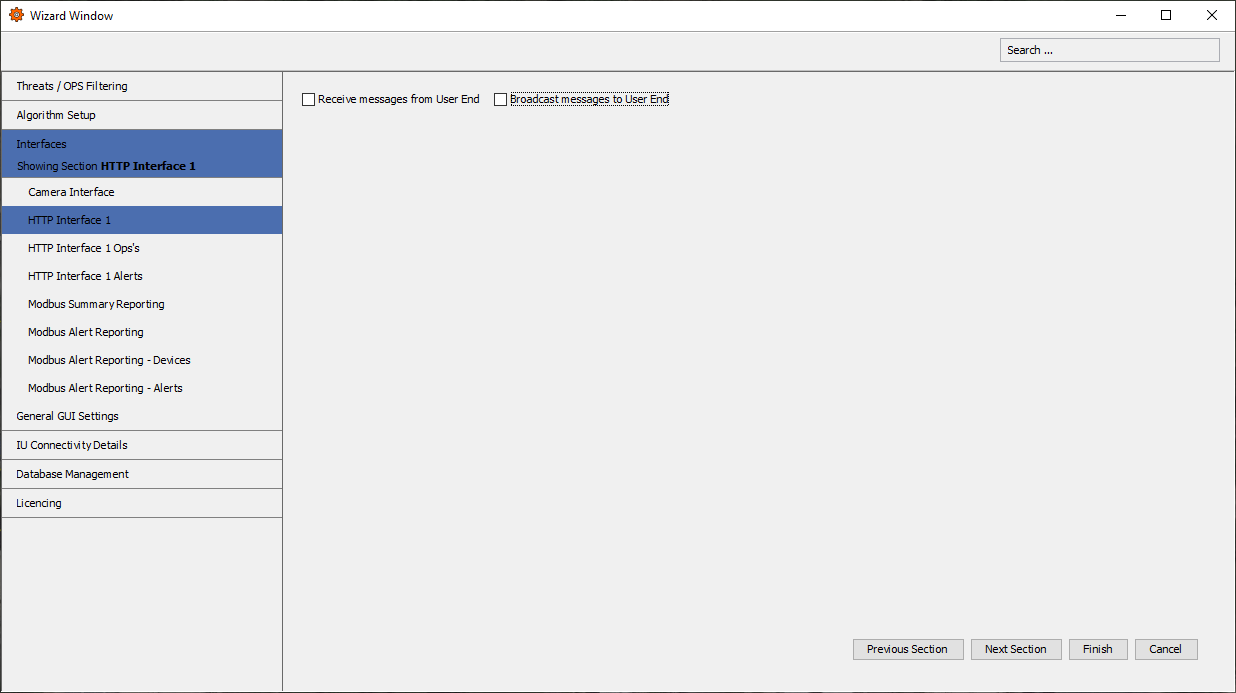
Figure 1489: HTTP Interface 1 Window
Depending on the setup enable the receive and broadcast options to reveal the outgoing settings. Set the clients server as the test tool IP address.
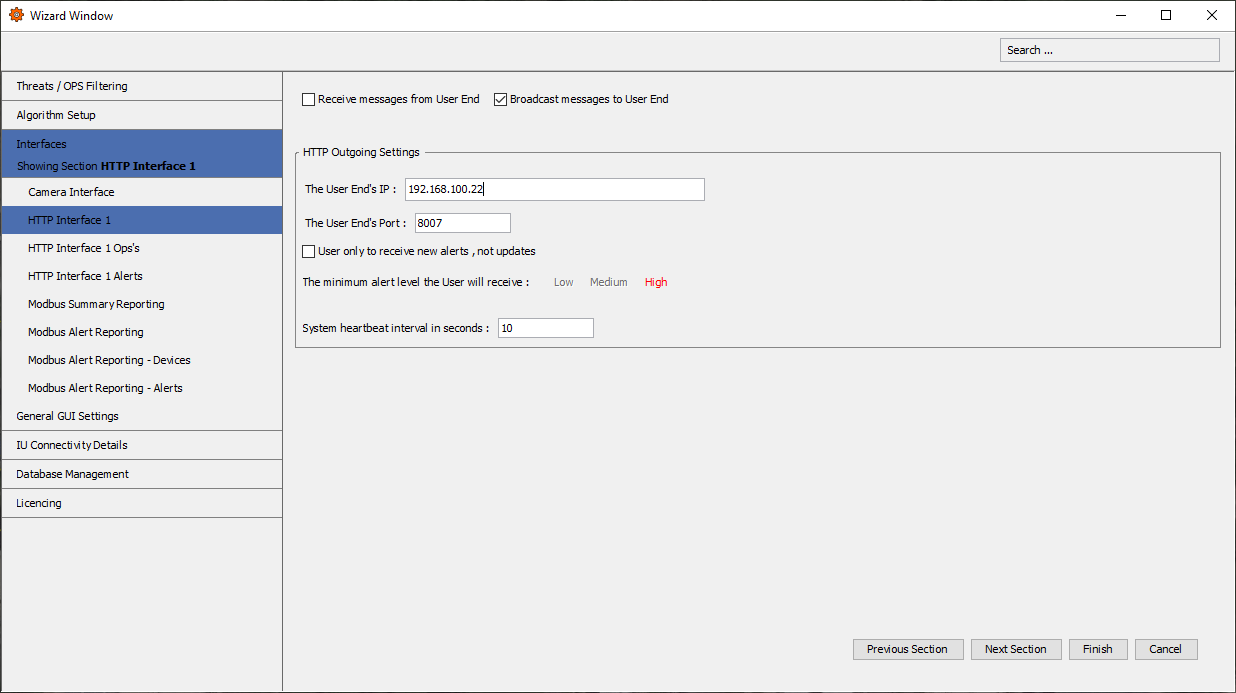
Figure 14930: HTTP Interface
The next section allows the configuration to output or block the alerts from any of the available OPS’s.
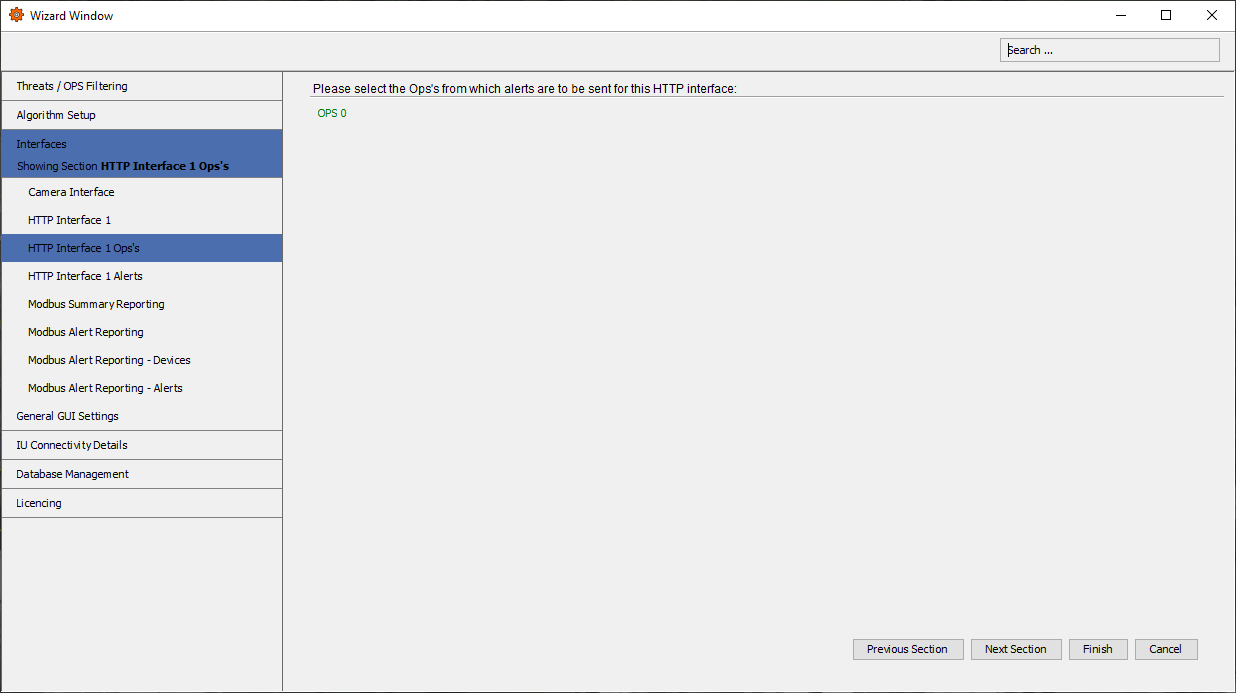
Figure 150: HTTP Interface OPS’s
The last section allows the configuration to output or block the individual alert types from being posted via the HTTP tool.
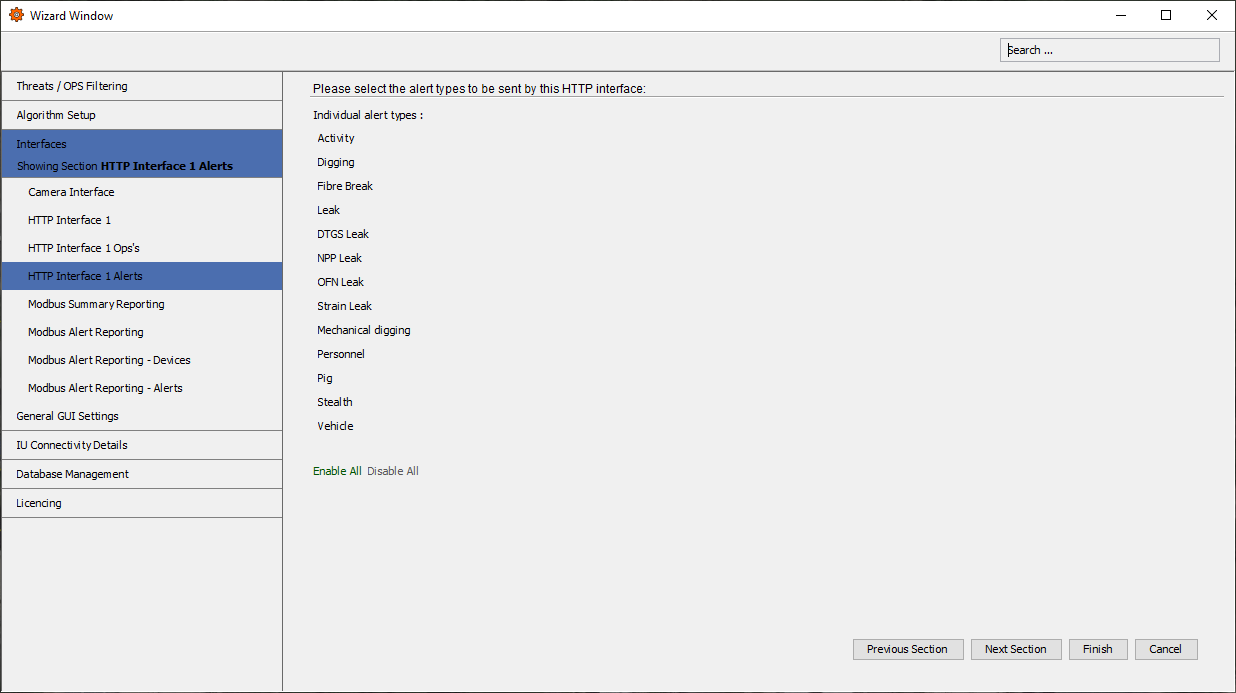
Figure 151: HTTP Interface Alerts
Test Tool
Once the OptaSense GUI has been restarted, you can check to see if the server is running by starting the HTTP Interface Test Tool provided in the software.
The tool can be found in Test Tools menu.

Figure 152: Launching HTTP Test Tool
The HTTP Interface Test Tool window will then open, allowing the user to test that the HTTP interface has been successfully configured.
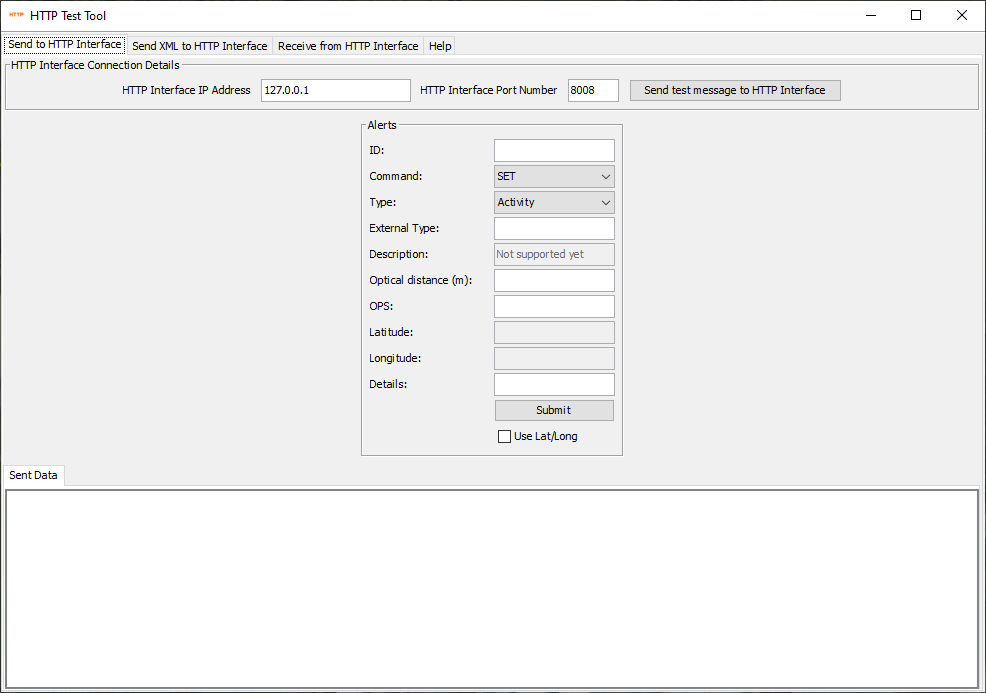
Figure 153: HTTP Interface Test Tool
HTTPS Interface - Setup
To integrate the HTTP(S) Interface into the OS software, it will need to be available as a service via the System Descriptor Editor. For information on how to install an additional process, refer to section 2.
In terms of functionality, HTTPS can operationally perform in the same method as HTTP, outlined above, however with the additional benefit of sending secure messages encrypted using Transport Layer Security.
To configure this additional functionality in the OS software, the following extra steps are required to generate a self-signed certificate to enable the HTTPS interface:
- Within Windows ProgramFiles, navigate to \OptaSense5.11.x\bin\utilities and run the script “generateHTTPSInterfaceTestCert.bat”.
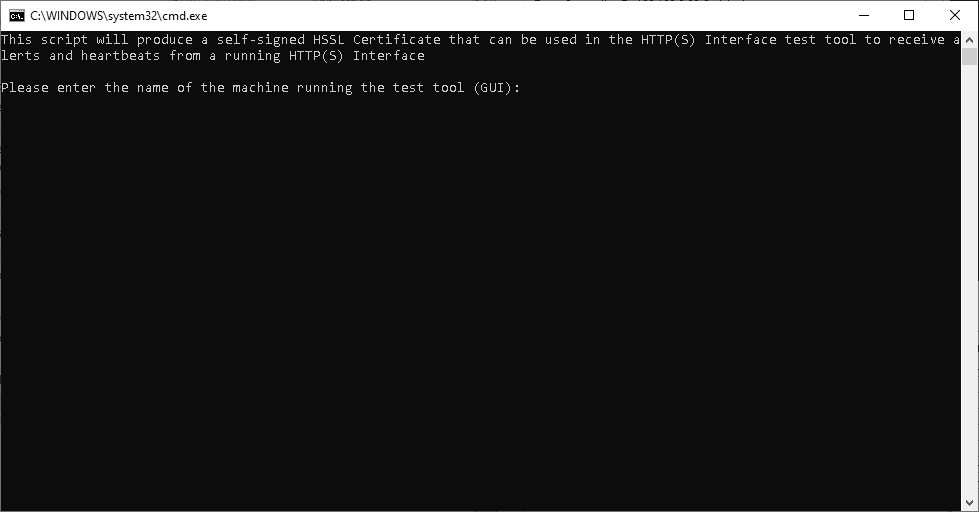
Figure 154: generateHTTPSInterfaceTestCert.bat
Complete required fields when directed:
- The hostname of CU.
- IP Address of CU.
A file is created in C:\Users\Admin\AppData\Local\Temp\httpsTest.keystore, it is recommended this is copied to a safe location. This certificate will act as the self-signed certificate to load into the HTTP(S) test tool on the GUI to authenticate the HTTPS test server.
- It is now necessary to extract a pem certificate from the CU. This can be uploaded to the PU, which will then create a private key so secure messages can then be generated and published. Open the internet browser (Firefox) on the CU and navigate its own IP address using the following format - https://192.168.x.x:8007/
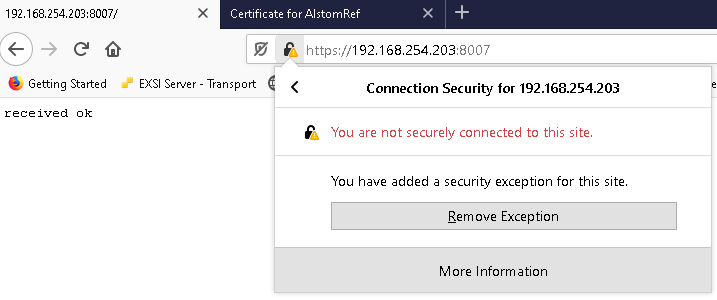
Figure 155: Extract certificate
- Once connected, the webpage should show received ok. From here select the Firefox security shield and navigate to Connection Not Secure Arrow > More Information > View Certificate.
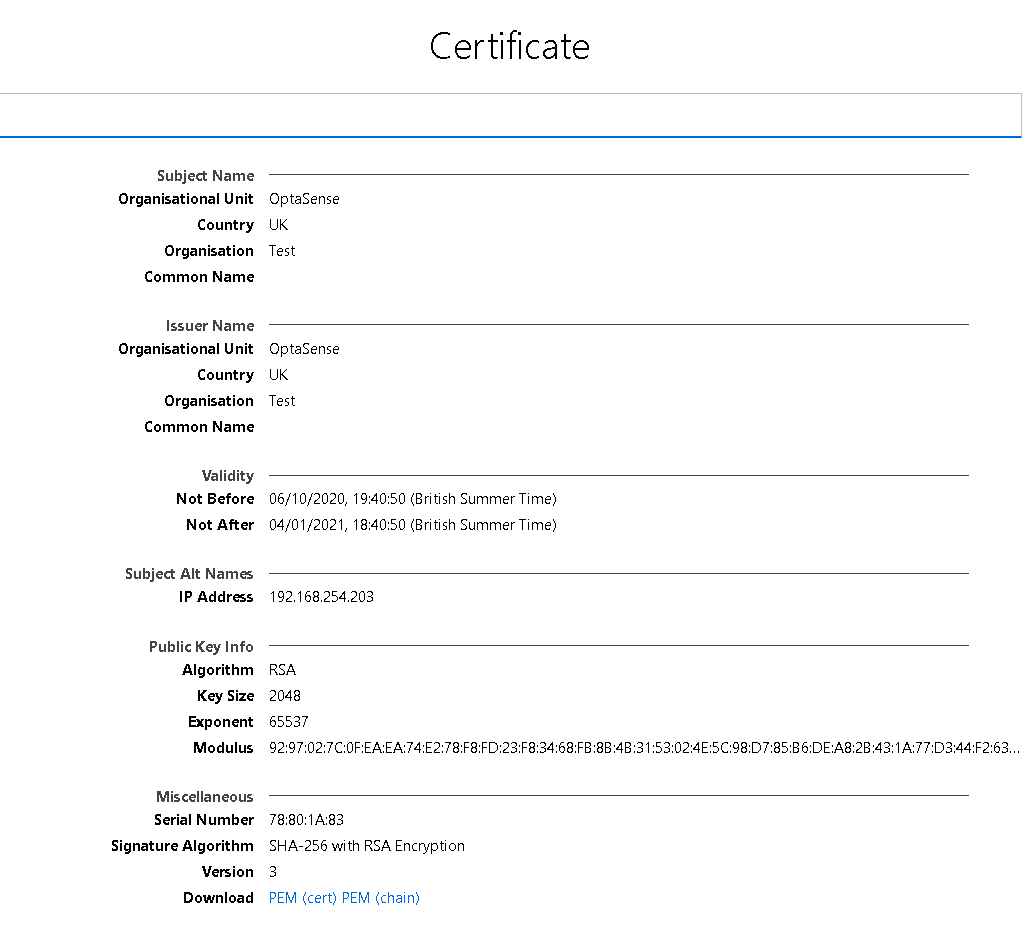
Figure 156: Certificate Download
- Download the certificate and save in the same location as the keystore file. Run Windows ProgramFiles \OptaSense5.11.x\bin\utilities\importCertToJavaKeystoreOnPU.bat. This batch file is used to upload the generated pem file to the PU to complete authentication.
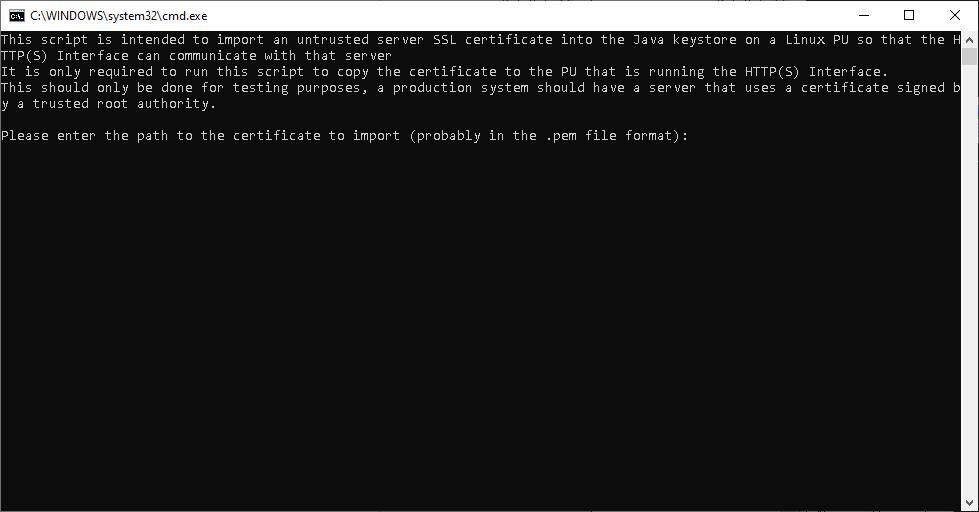
Figure 157: Upload pem to PU
- Complete the batch file by entering:
- The full Windows path to the pem file.
- IP Address of the PU
- OptaAdmin password to authenticate upload credentials
On successful completion of this step, the HTTPS server tool can now be set up to provide confirmation that messages are being sent via HTTPS. Open the HTTP Interface Test Tool and navigate to the Receive from HTTP interface:

Figure 158: HTTP Interface Test Tool
- Select Use HTTPS checkbox and point to the Keystore file saved previously. Given there are no errors with the certificate file, you should be able to start the HTTP(S) server. Select start HTTPS server button and test by sending zoned in alerts and verify the XML message data output is displayed within.
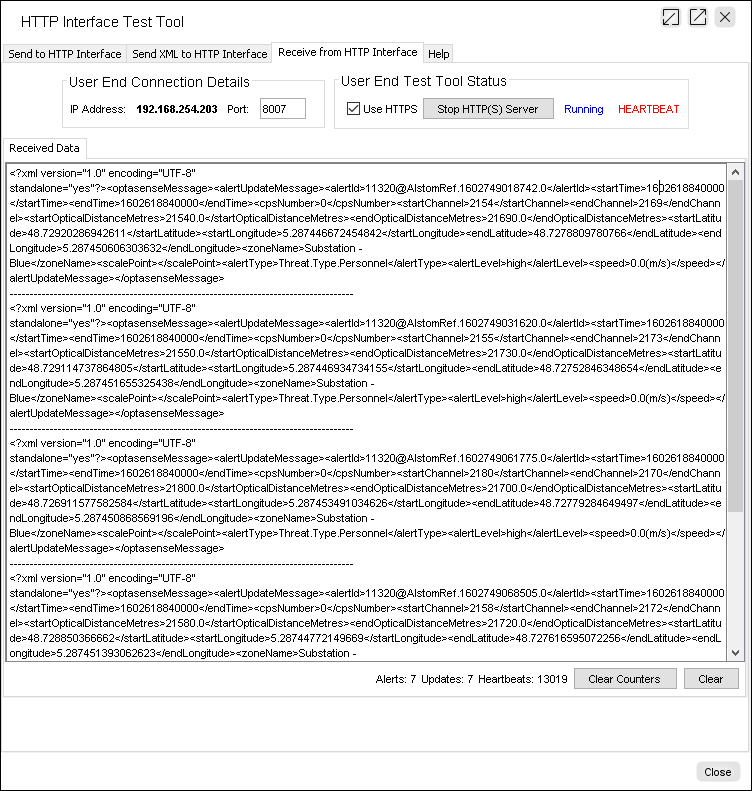
Figure 159: Starting HTTP(S) Server
Modbus Alert Reporting Interface
Introduction
The OptaSense Modbus interface is a 16-bit TCP/IP interface designed to allow the mapping of alerts and errors to discrete Modbus channels. This therefore allows the presence of an alert on the OptaSense system to be notified and can be further investigated and understood via the OptaSense system interface.
To present this data via a Modbus interface, the OptaSense server will construct and hold an array of registers, sufficient in quantity to maintain an Alarm register and an Acknowledgment register for each channel. Depending on how many alert types are required, this can be a total of 2 registers per channel (up to 16 alert types) or 4 registers per channel (up to 32 alert types). Configuring which of these sizes is used is an adjustable setting within the OptaSense system.
There are two methods of interfacing with Modbus available in OS6. The first, which is applicable for OS3.6 and above, utilises a summary method of publishing alarms. This method is the simplest of the two methods, where alarm information will be published, but cannot receive any acknowledgement information back from the Modbus system. Modbus Alert Reporting is an interface created specifically for one of our customers and allows the user to receive Modbus information based on channel numbers and alert types however, this would need to setup specifically for each new customer request. Both interfaces can be run at once however it is essential that they are not run off the same port or to the same source IP address. Please also consult the Modbus interface specification for further information.
Adding the Interface
The Modbus interface is attached to the system as an external process on the System Install Scheduler. For information on the manipulation of the Install Scheduler please consult Module 12
Configuring Modbus
In the setup wizard found in the OptaSense software, the following can be configured:
- Connection Settings:
- IP address of card connected to third party system
- Modbus Interface port
- Modbus Configuration Settings:
- Starting register value
- Number of registers per channel (2 for Summary Reporting or 2/4 for Alert reporting)
- Mapping of Alert types to Register flags
- Mapping of Devices
This section will describe the steps involved in configuring the above. For more information on the config wizard please consult OS6 Manual Module 7.
To launch the setup wizard, click on the icon found in the ‘engineering’ tab in the OptaSense software.
Figure 160: Engineering Tab
Modbus Summary Reporting – General Modbus
With the setup wizard launched, select the ‘interfaces’ tab from the menu found on the left-hand side.
With the interfaces window open, scroll down to the ‘Modbus Details Interface’ option and select this option.
In this window, the connection settings can be configured. The IP address will be predetermined before installation but can also be found in the network diagram. As a default, the port will be the IANA well-known port of 502. All device requests will be passed through this port to the ‘virtual’ devices. In this window, the user can see which numbers the Modbus alerts are mapped to. As the System status uses the address 40001, the starting register address is typically 40002. The system will either use registers per channel (up to 16 alert types).
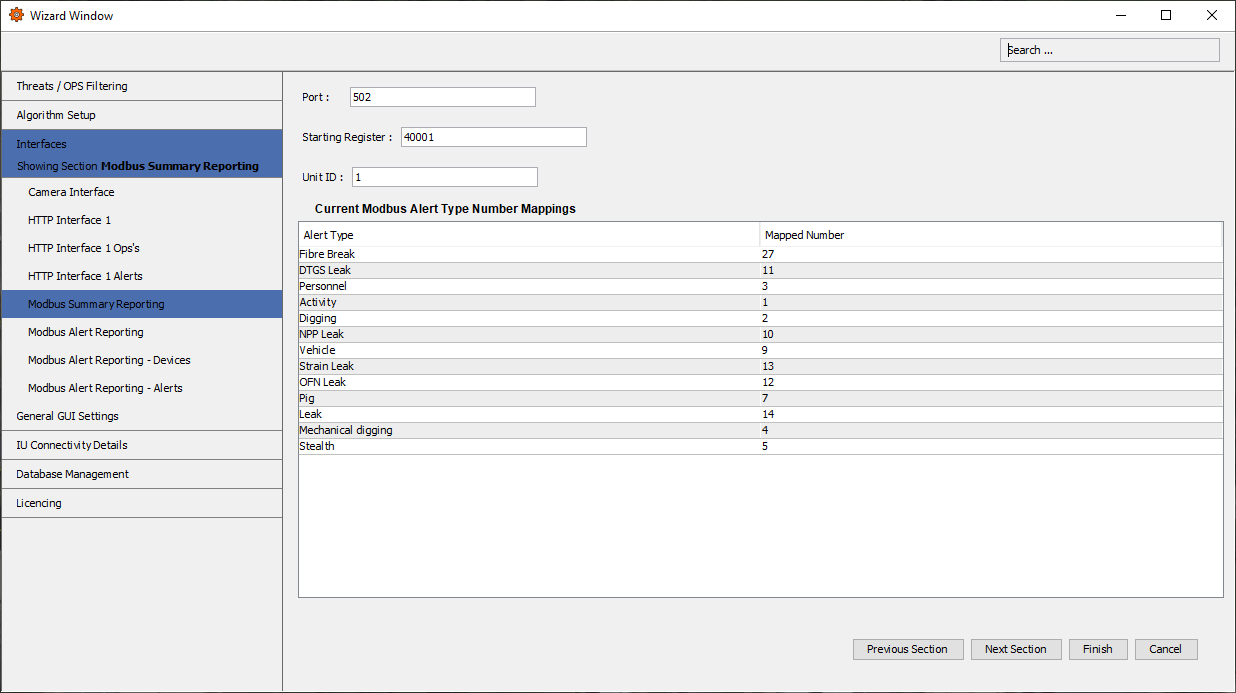
Figure 161: Modbus Summary Reporting Interface
Testing Modbus Summary Reporting
To test the MODBUS Summary interface, a polling device should be attached to the network that has connectivity to the IP address specified above.
The remainder of this document contains reference to the use of the MODBUS Poll tool that is available from MODBUS Tools. This tool simulates the continual polling of the MODBUS register entries on the given port.
Open the Modbus poll tool and under the setup menu, select ‘Read/Write’ definitions.

Figure 162: Modbus Poll Utility –Setup Tab
- Once opened, you should be displayed with the following window:
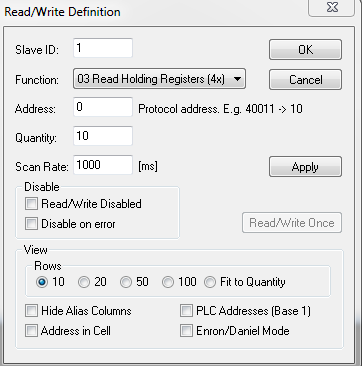
Figure 163: Modbus Poll Read/Write Definition
-
The slave ID would be what is configured in the wizard Modbus section (by default this is 1 and does not need to be changed unless changed in the wizard).
-
The function should be chosen to be “03 Read Holding Registers”.
-
The address should always start from 0.
-
The quantity field is how many registers Modbus poll should read. This number is ‘(n * 4) + 4’ where ‘n’ is the number of detectors being used.
-
In the rows panel, always select ‘Fit to Quantity’ and select Apply then OK.
-
Open the ‘connection setup’ window. This is accessed through the connection menu.
Figure 164: Modbus Poll Utility – Connection Tab
- Once opened, you should be displayed with the following window:
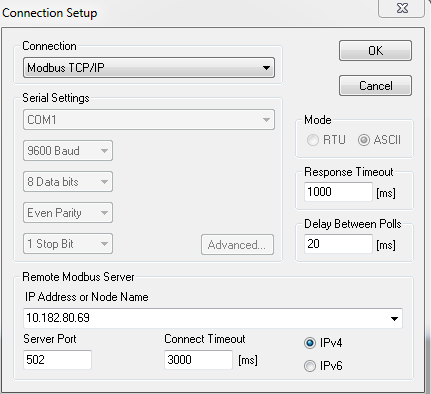
Figure 165: Modbus Poll Utility – TCP/IP Setup
- The connection should be set to Modbus TCP/IP
- The mode should be set to ASCII
- In the ‘Remote Modbus Server’ panel section, the IP address should be set to that configured in the wizard (the address of the node running the process)
- The port should be what is configured in the wizard, the default it is 502 and should not be changed unless changed in the wizard
- Once all these parameters are set, you can press OK and data should be displayed in the registries.
- To test, inject alerts into OLA and ensure the correct registries are changed.
The figure below shows how the mapped alerts from the OptaSense software appear in Modbus poll software. The first register 0 is listed as -1, this denotes that the ‘System Health’ is in the red state, if the system is in a green state this will be 1. Register 1 shows the total number of all unacknowledged high alerts (10) in the system. 2 shows total medium alerts (5) and 3 shows low alerts (2). The next register, 4, shows the map no 9 (Alert Type) which corresponds to vehicle. The next 3 registers are the number of high, medium and low alerts. Register 8 is the map number to head the next 4 registers and so on and so on.
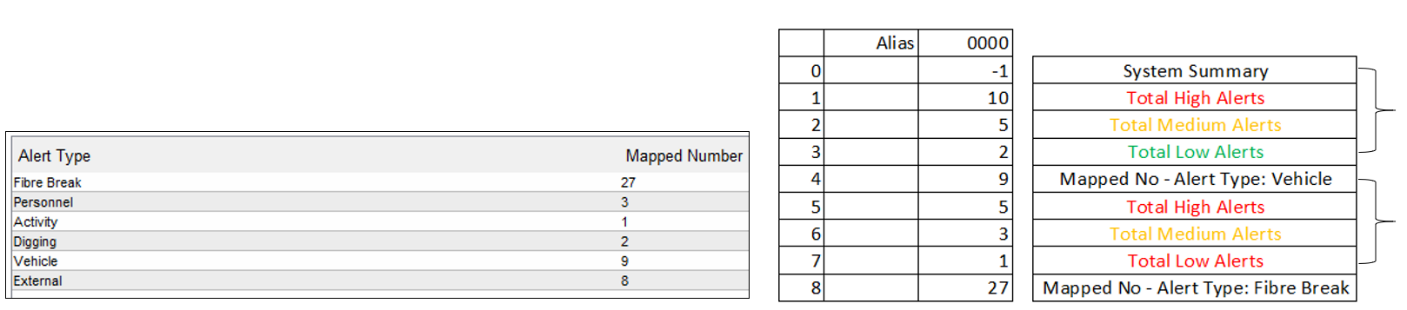
Figure 166: Modbus Registers
Note: Right Image above; The first 4 registers are always taken by: System Health. Total number of high system alerts. Total number of medium system alerts. Total number of low system alerts. The mapped numbers that follow will appear as per detectors order.
Modbus Details Reporting – Client Specific
With the setup wizard launched, select the ‘interfaces’ tab from the menu found on the left-hand side, clicking ‘Modbus Alert Reporting - Alerts’ will bring up the Modbus Threat Mapping section.
This section allows the configuration to output or block the individual alert types from being posted via the Modbus interface. To add a new alert, simply click ‘Add’ found at the bottom of this window. Likewise, to remove an alert from being publish, click ‘Remove’.
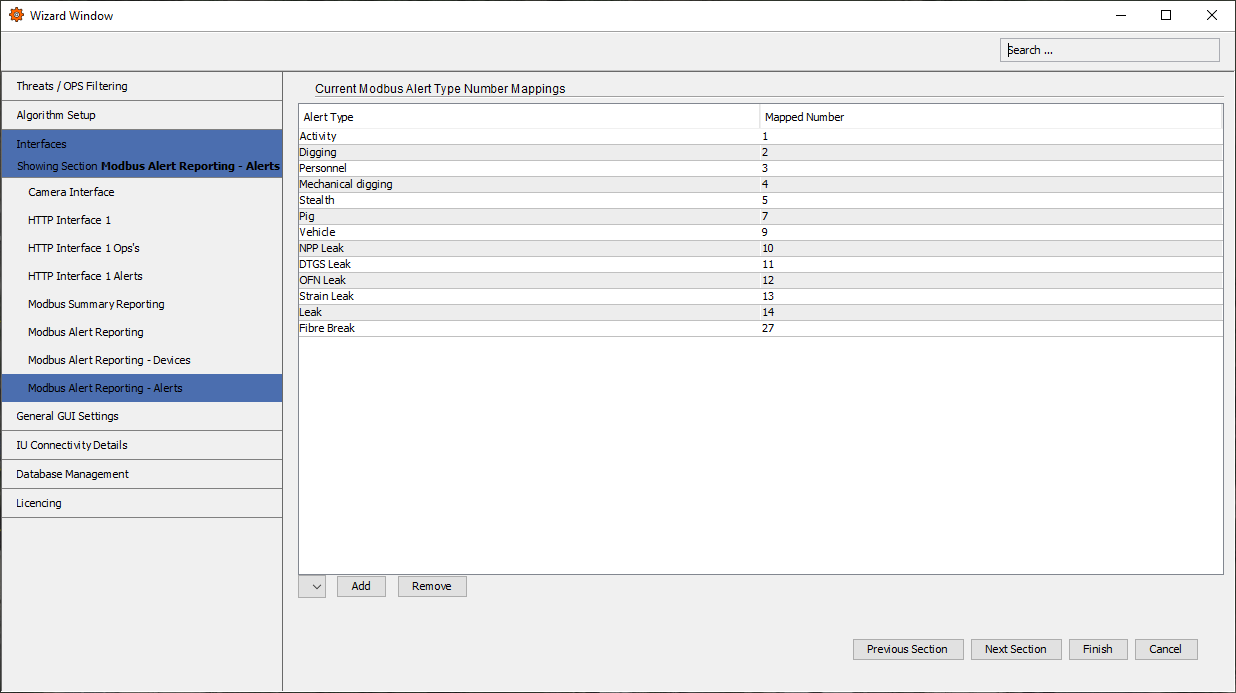
Figure 167: Modbus Threat Mapping
Once the threat mapping is complete, click ‘Next Section’ to go to the ‘Modbus Device Configuration’ window.
The Modbus interface utilises ‘devices’ as a method of mapping alerts. These devices will not exist as separate electronic devices but are akin to predefined database ‘Views’ allowing the interface to request a segment of the fibre data rather than having to interpret the full data set.
Each device can be set with a ‘Device ID’ which can be entered in this section. Also, this section where the start and end channel for the channel range to be associated with this device can be entered. Please note, the channel range cannot exceed 63 channels.
Error messages will be displayed if inappropriate integers are applied throughout the setup process.
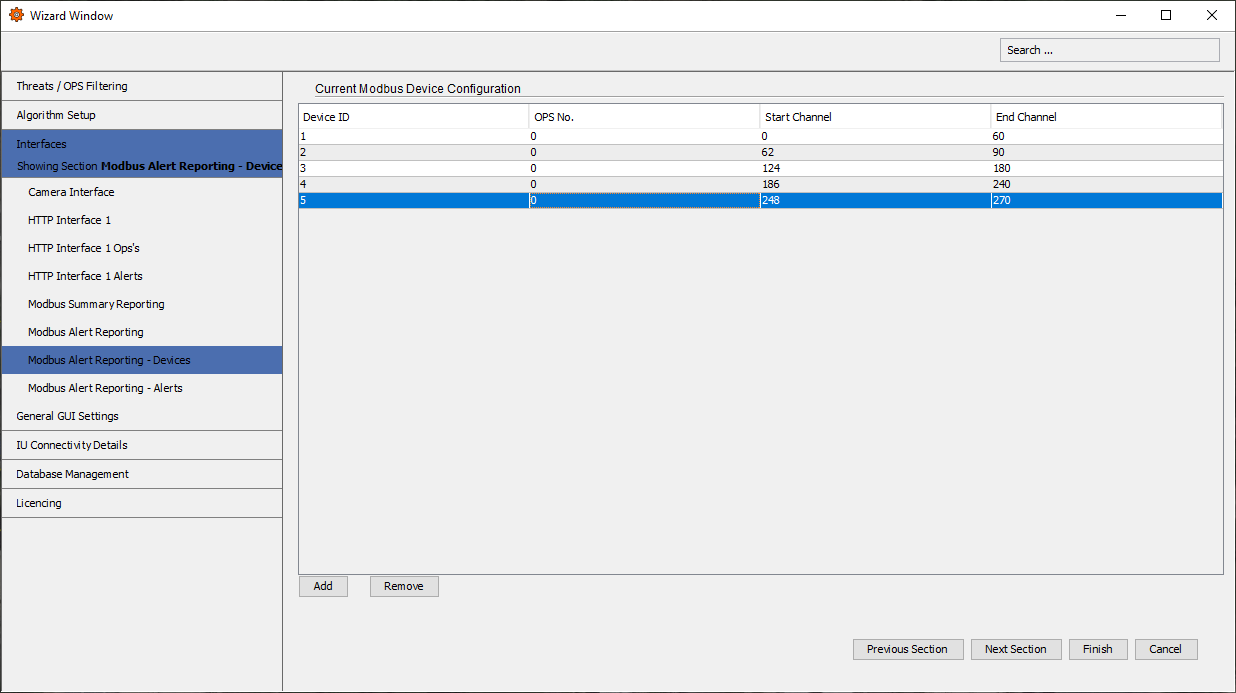
Figure 168: Modbus Device Configuration
Testing Modbus Details Reporting
Once the OptaSense GUI has been restarted, check to see if the Modbus interface is running by starting the Modbus Details Test under the Test Tools menu

Figure 169: Modbus Details Test
With the Modbus Test Tool launched, the launch window will open to the ‘Modbus Alerts’ tab, Figure 167. This tab is where the Modbus Test Tool can be started, and once started, alerts can be observed.
Prior to starting the tool, it is worthwhile reviewing the other tabs to ensure they are configured correctly for the tool to work.
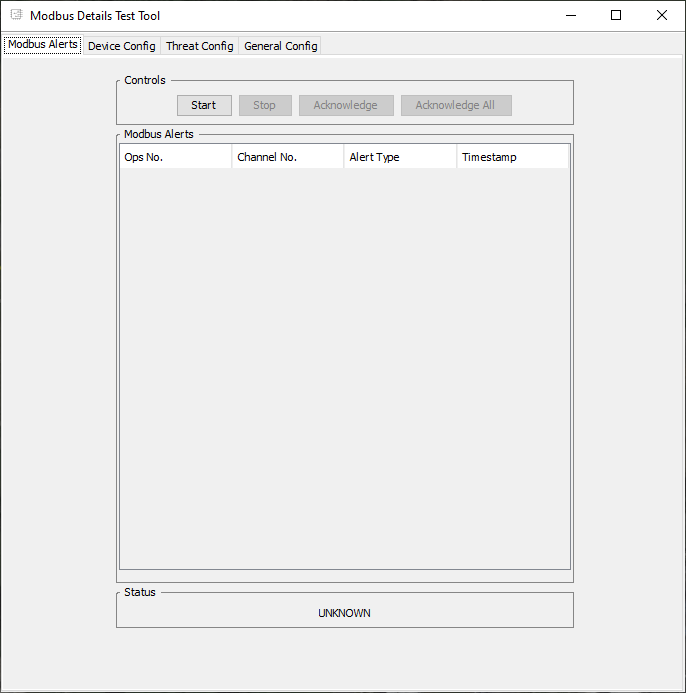
Figure 170: Modbus Alerts Tab
The Device Config tab Figure 168 displays how the Modbus devices are configured. It is vital that this window matches the settings set in the ‘Modbus Device Configuration’ window in the setup wizard.
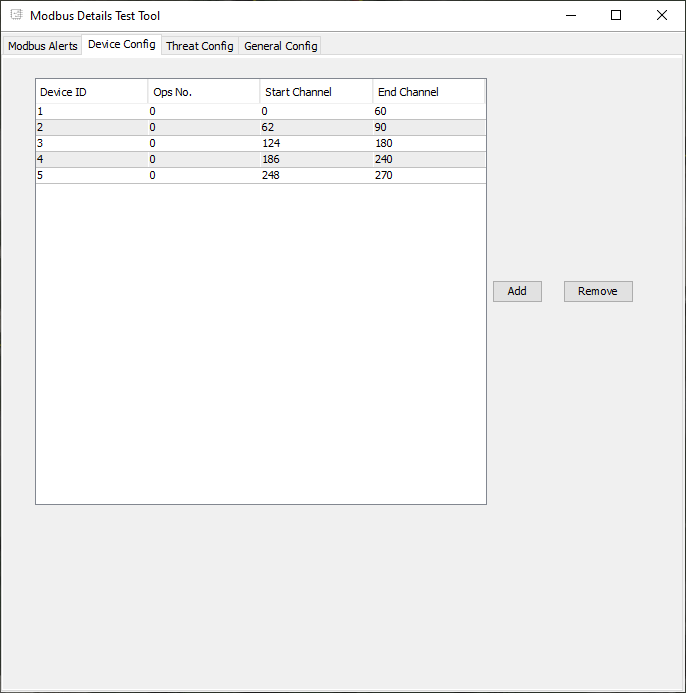
Figure 171: Device Config Tab
The Threat Config tab Figure 169 displays which alert types are mapped in the Modbus register. No settings need to be changed in this tab.
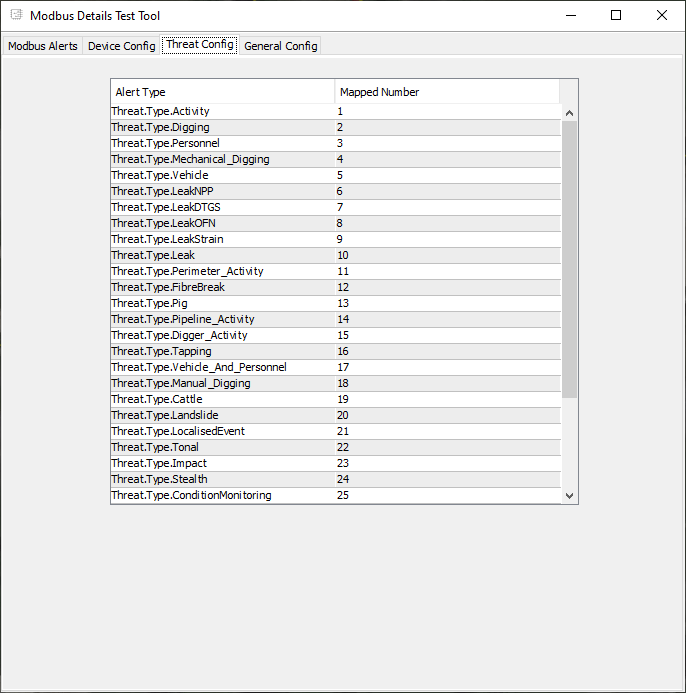
Figure 172: Threat Config Tab
The final tab in the Modbus Test Tool is the General Config tab. In this tab, the following needs the entered:
- Port: 502 (default)
- Modbus IP Address: The IP address of the node running Modbus
- Modbus Poll Period (ms): 2000 (default)
- Starting register: Must match value entered in ‘Modbus Details Interface’ in setup wizard
- Registers per Channel: Must match value entered in ‘Modbus Details Interface’ in setup wizard
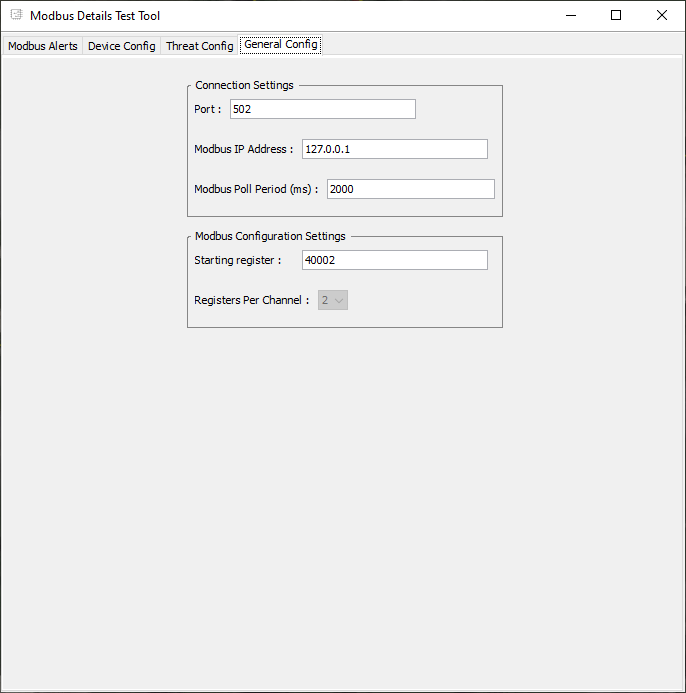
Figure 173: General Config Tab
With the Test Tool fully configured, by clicking ‘start’ in the Modbus Alert tab will launch the tool. If successfully configured, OptaSense system alerts will now start to appear in the Modbus Alerts tote. Verification of the test can be done by acknowledging an alert in the tool and comparing with the OptaSense system that this alert has been acknowledged.
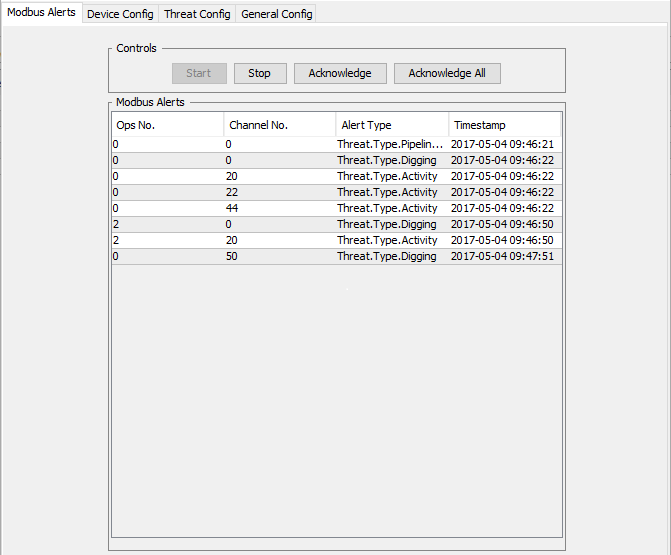
Figure 174: Modbus Alerts Tab (With Alerts)
OptaSense Connect
Adding the Interface
The Connect Agent Interface is attached to the system as an external process on the System Install Scheduler. For information on the manipulation of the Install Scheduler please consult Module 12.
Introduction
The Optasense Connect Agent Interface allows Optasense OS6 System Health data to be sent to the cloud-based health monitoring system: Connect. This system can form part of a remote Support offering to the customer (managed by OptaSense or the customer)
This cloud-based system allows remote monitoring of an OS6 without the need to login into the OS6 System directly. This cloud-based system also allows emails to be sent to named users based on Health rules of the OS6 System (e.g. Failed communication to an IU)


Figure 175: Connect Health

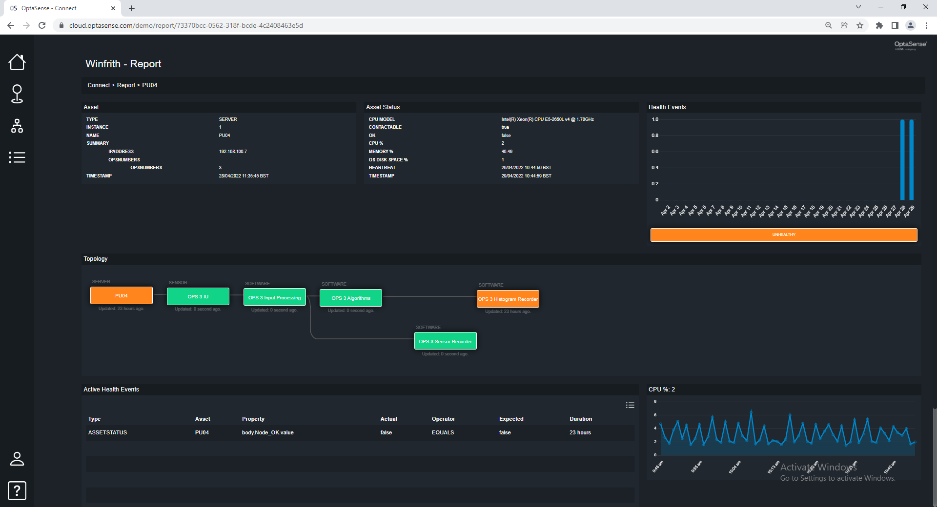
Figure 176: Connect Report
Data sent to Connect
- OS6 only forwards System Health data to ‘Connect’.
- No Sensitive information, such as Alert Information or geographical positions (Alerts, Fibre Route, Assets etc) is sent to Connect.
Data Hierarchy
Below highlights the data hierarchy sent to Connect:
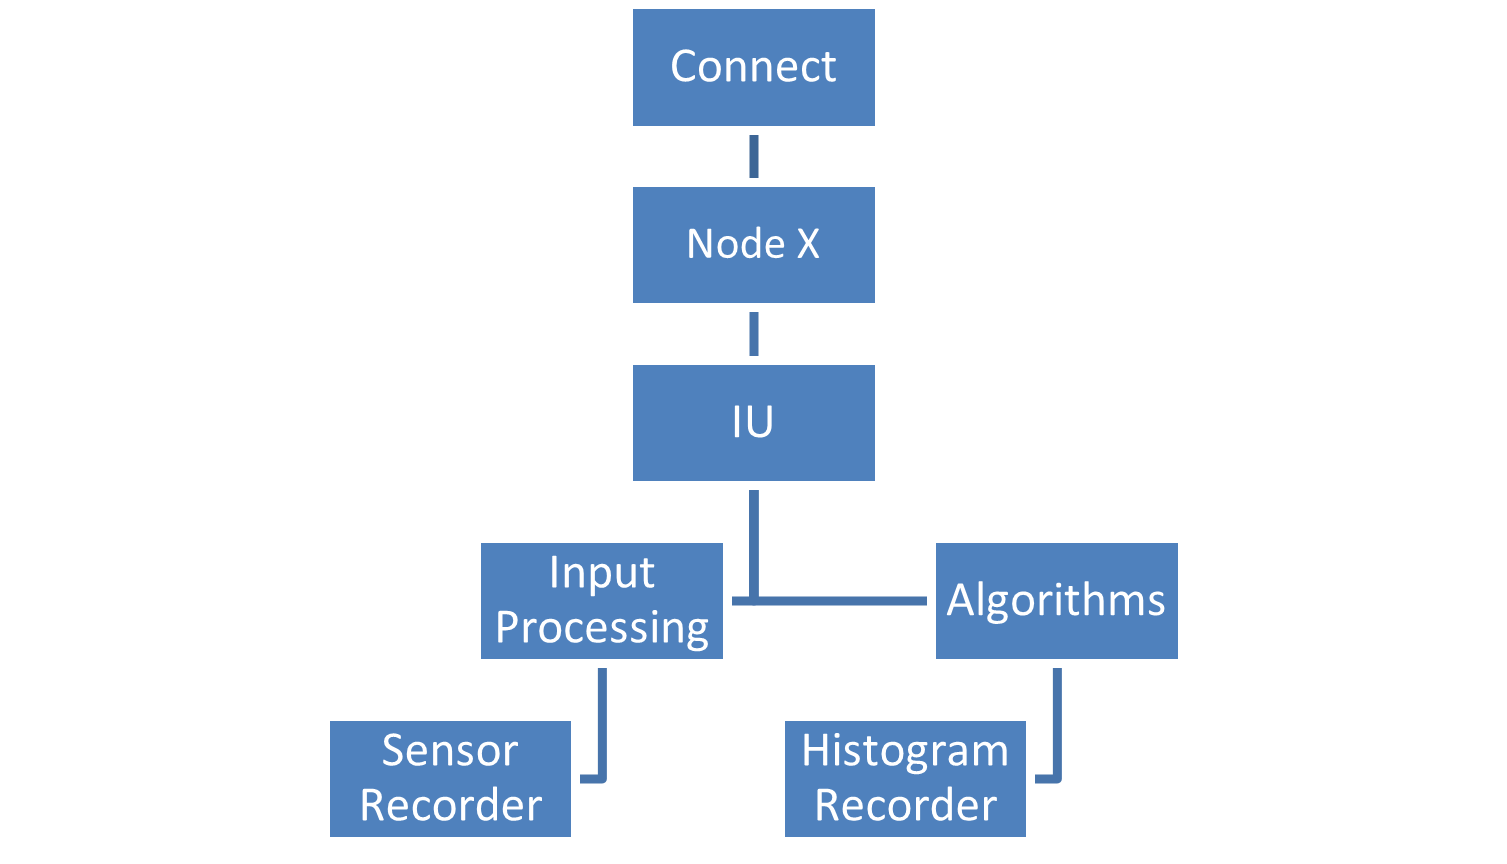
Figure 177: Connect Data hierarchy for One node
Below highlights the data that is within the Node Asset:
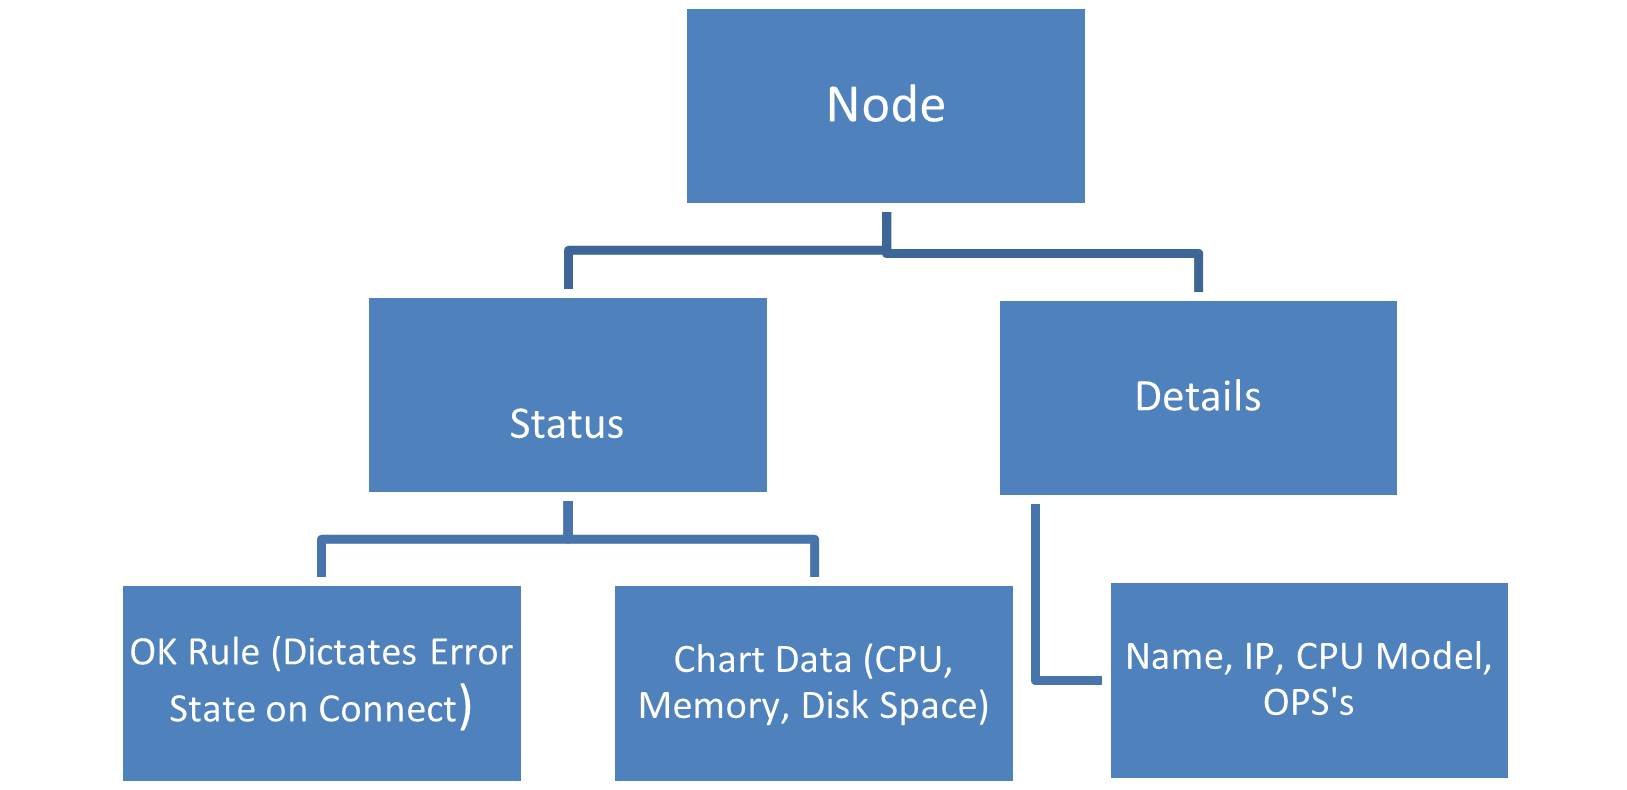
As Figure 152 shows, each node will have a pre-determined rule which controls if the node is in a ‘Bad’ or ‘Good’ state on Connect. This rule uses the same data that System Health uses to determine a nodes health.
Below highlights the data that is within the IU Asset:
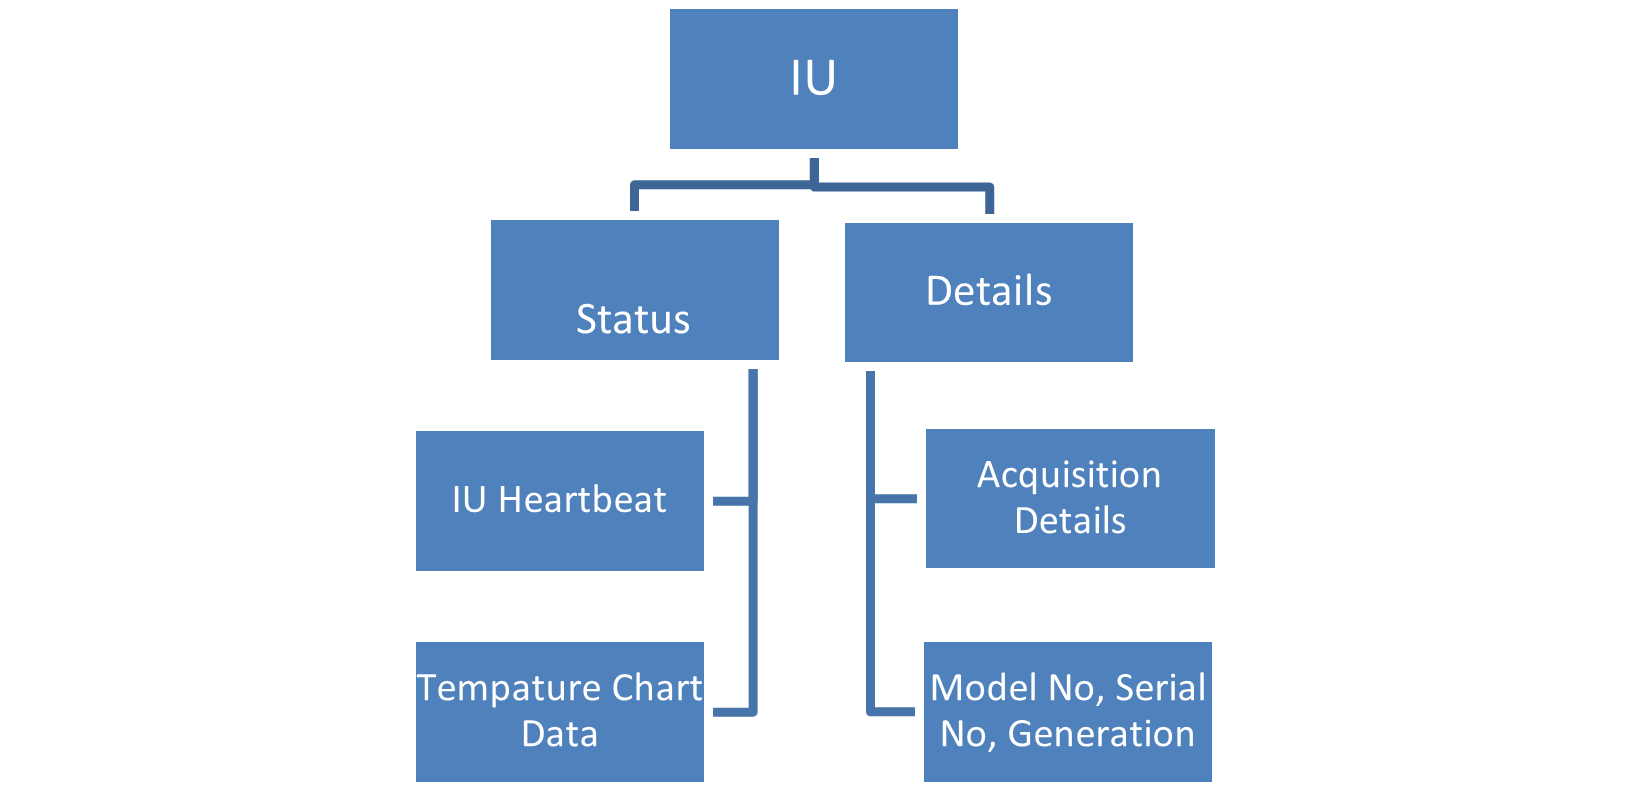
As Figure 153 shows, an IU heartbeat has been added which dictates to Connect if the IU is ‘working’. This heartbeat is determined by the last the system received sensor data for that IU.
Below highlights the data that is within a Process (Input Processing, Algorithms etc) Asset:
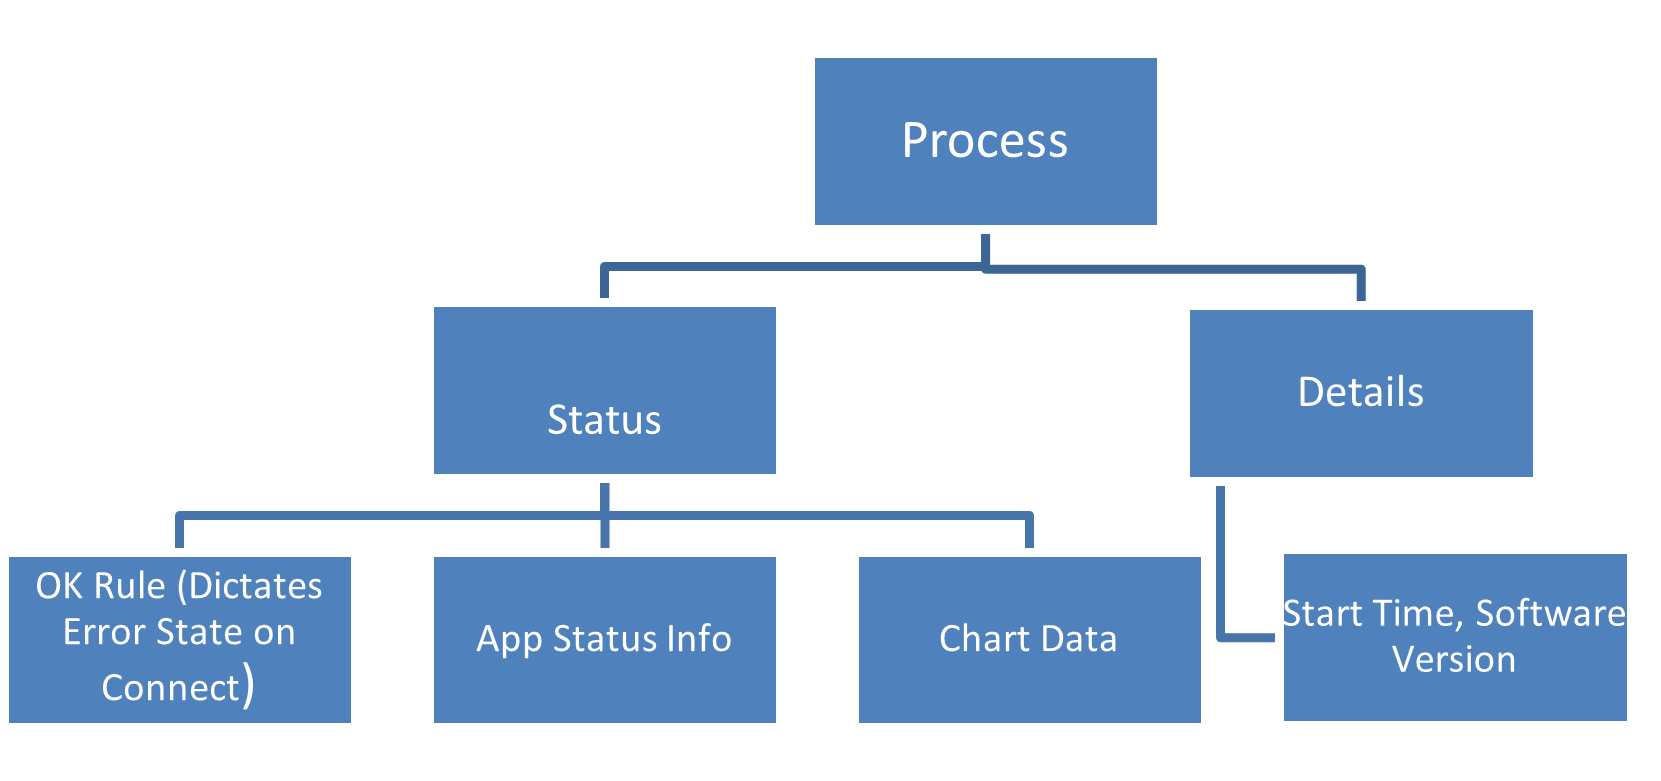
As Figure 154 shows, each process will have a pre-determined rule which controls if the process is in a ‘Bad’ or ‘Good’ state on Connect. This rule uses the same data that System Health uses to determine a processes health.
Configure the Connect agent
To connect the agent to Connect, open the ‘Connect Agent Configuration’ section within the Wizard.
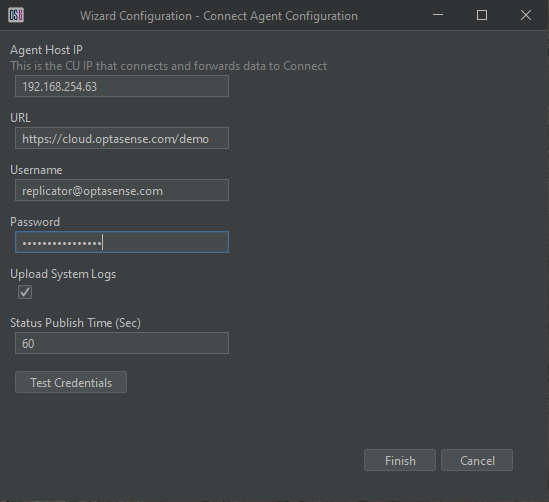
Figure 181: Connect Agent Configuration
Below details the settings that need to be entered to configure Connect:
-
Agent Host IP: This is the IP Address of the CU where the agent will run and forward data to Connect. This selected CU must have:
- OS6 running
- Connection to the internet
-
URL: This is the full URL of ‘Connect’. As Figure 178 showcases, the URL is unique for each customer/system (demo in the example case). The URL should be requested from Optasense Support each time the agent is being setup for a new customer/system.
-
Username/Password: These login credentials the agent will use will be unique for each customer/system. These details should be requested from OptaSense Support at the same time a request for the URL is made.
-
Upload System Logs: true if the system logs should be uploaded to Connect. For large systems or systems with a slow internet link may require this value to be turned off. If unsure, please contact OptaSense Support.
-
Status Publish Time: This dictates how frequent data is uploaded to Connect. In most cases this can be left as the default (60 Seconds), but for large systems or systems with a slow internet link it may require this value to be increased. If unsure, please contact OptaSense Support.
Once all details have been entered, the connection can be tested from the CU.
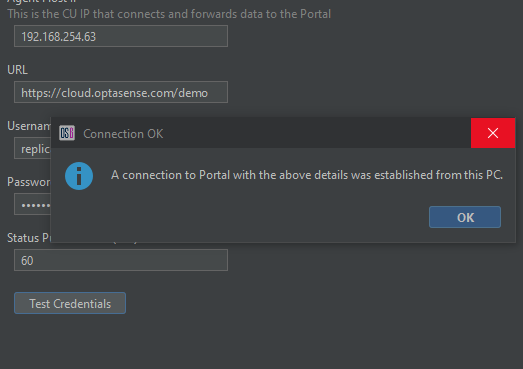
Figure 182: Successful connection to Connect
If the details are correct and there is a valid connection, a success result will be returned. The details can be saved which will automatically reload the agent with the newest details.
After a couple of minutes, a web-browser should be opened to confirm the agent is sending data as expected. The configured URL is what would be entered in on the browser, however the configured username/password is not valid for login to the Browser. A separate login will need to be requested from OptaSense Support.
If the customer is going to provide a ‘proxy’ for internet access, then complete the ‘Proxy Setup’ Tab with details which the customer will provide
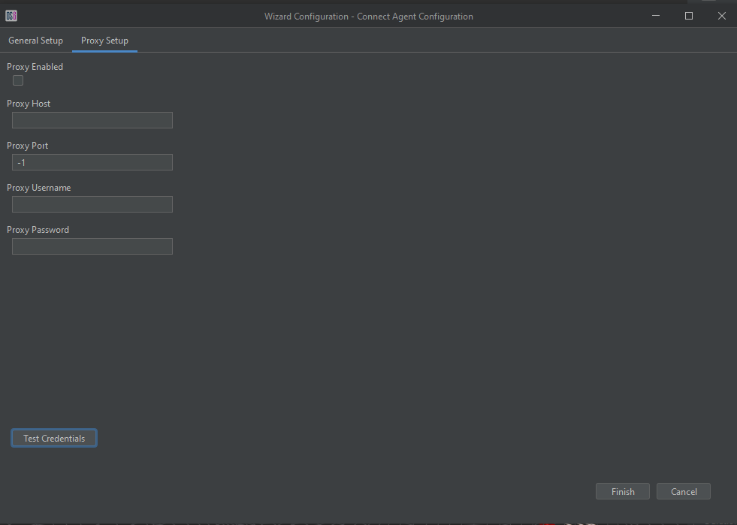
Figure 183: Proxy Setup